
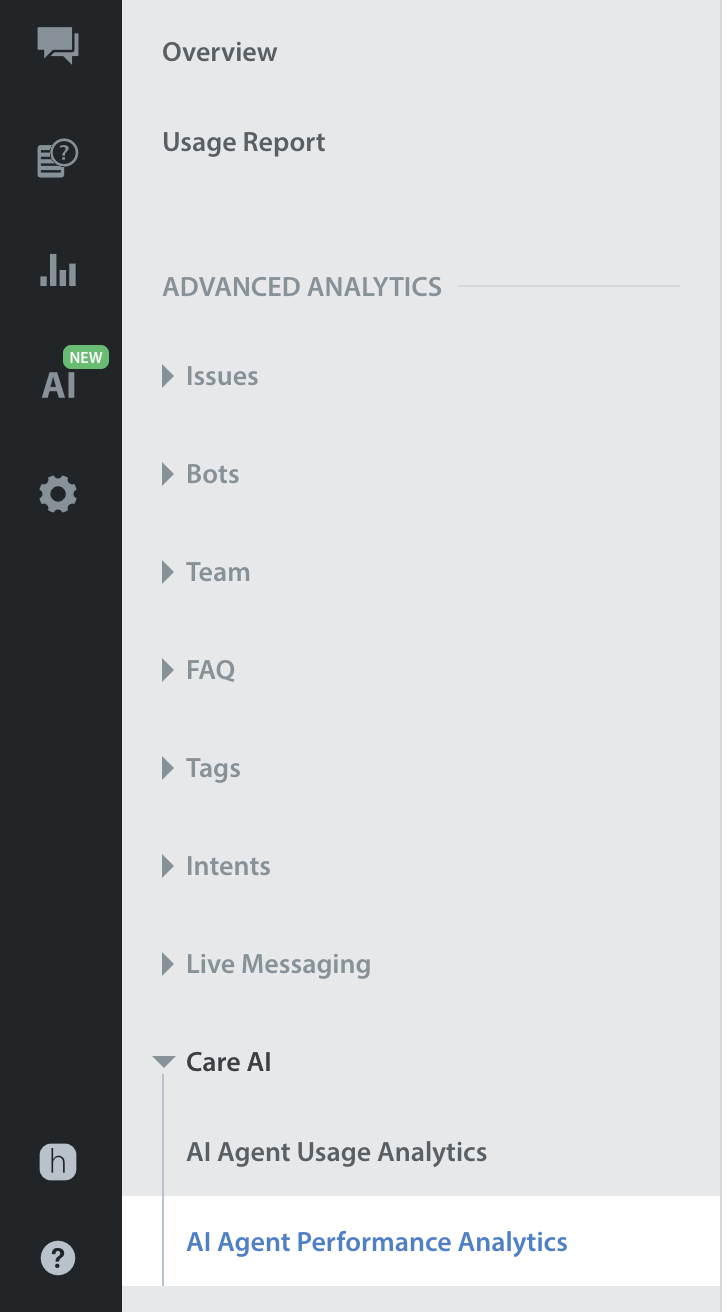
The information on Care AI Agent Performance Analytics is available under the Care AI section of Advanced Analytics.
Note: The Default date range for the report will be last 30 days; customers can change it using the filter.
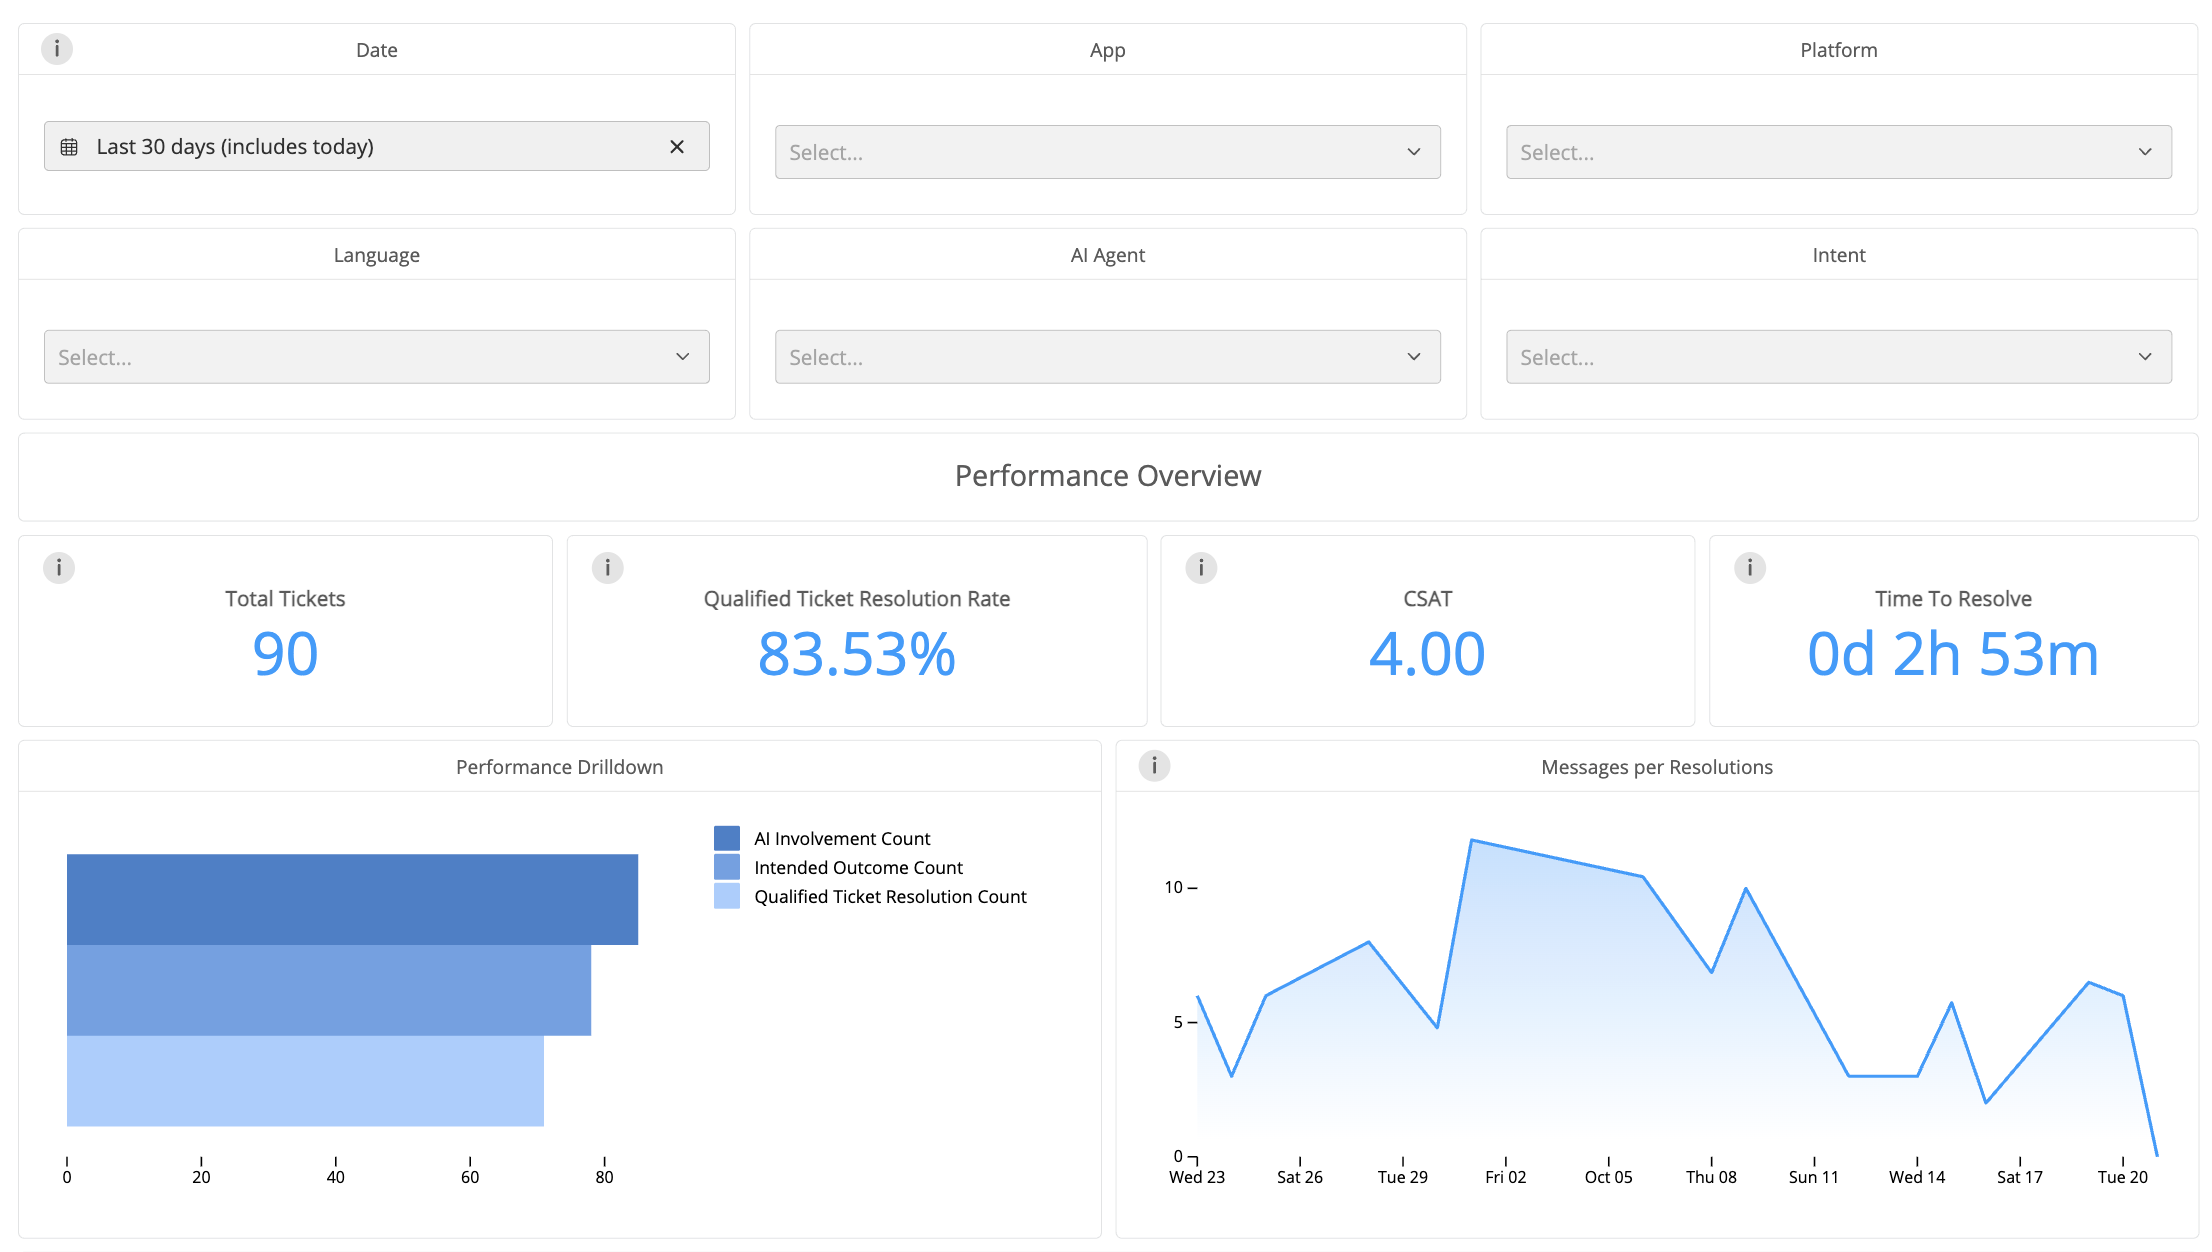
Metrics in the Care AI Agent section can be reviewed across various filters, like:
- Issue Creation Date
- AI Agent
- App
- Platform
- Language
- Intent
Notes:
All the metrics data shown in the report can be exported individually.
All data in this report is shown on the creation date.
Key metrics that can be explored within the AI Agent Performance Analytics report in the Performance Overview section are Total Tickets, Qualified Ticket Resolution, Time to Resolve, CSAT, Performance Drilldown, and Trend of Messages per resolution.
Note: The Care AI Agent section in Analytics is only available for customers who have enabled the Care AI Agent feature.
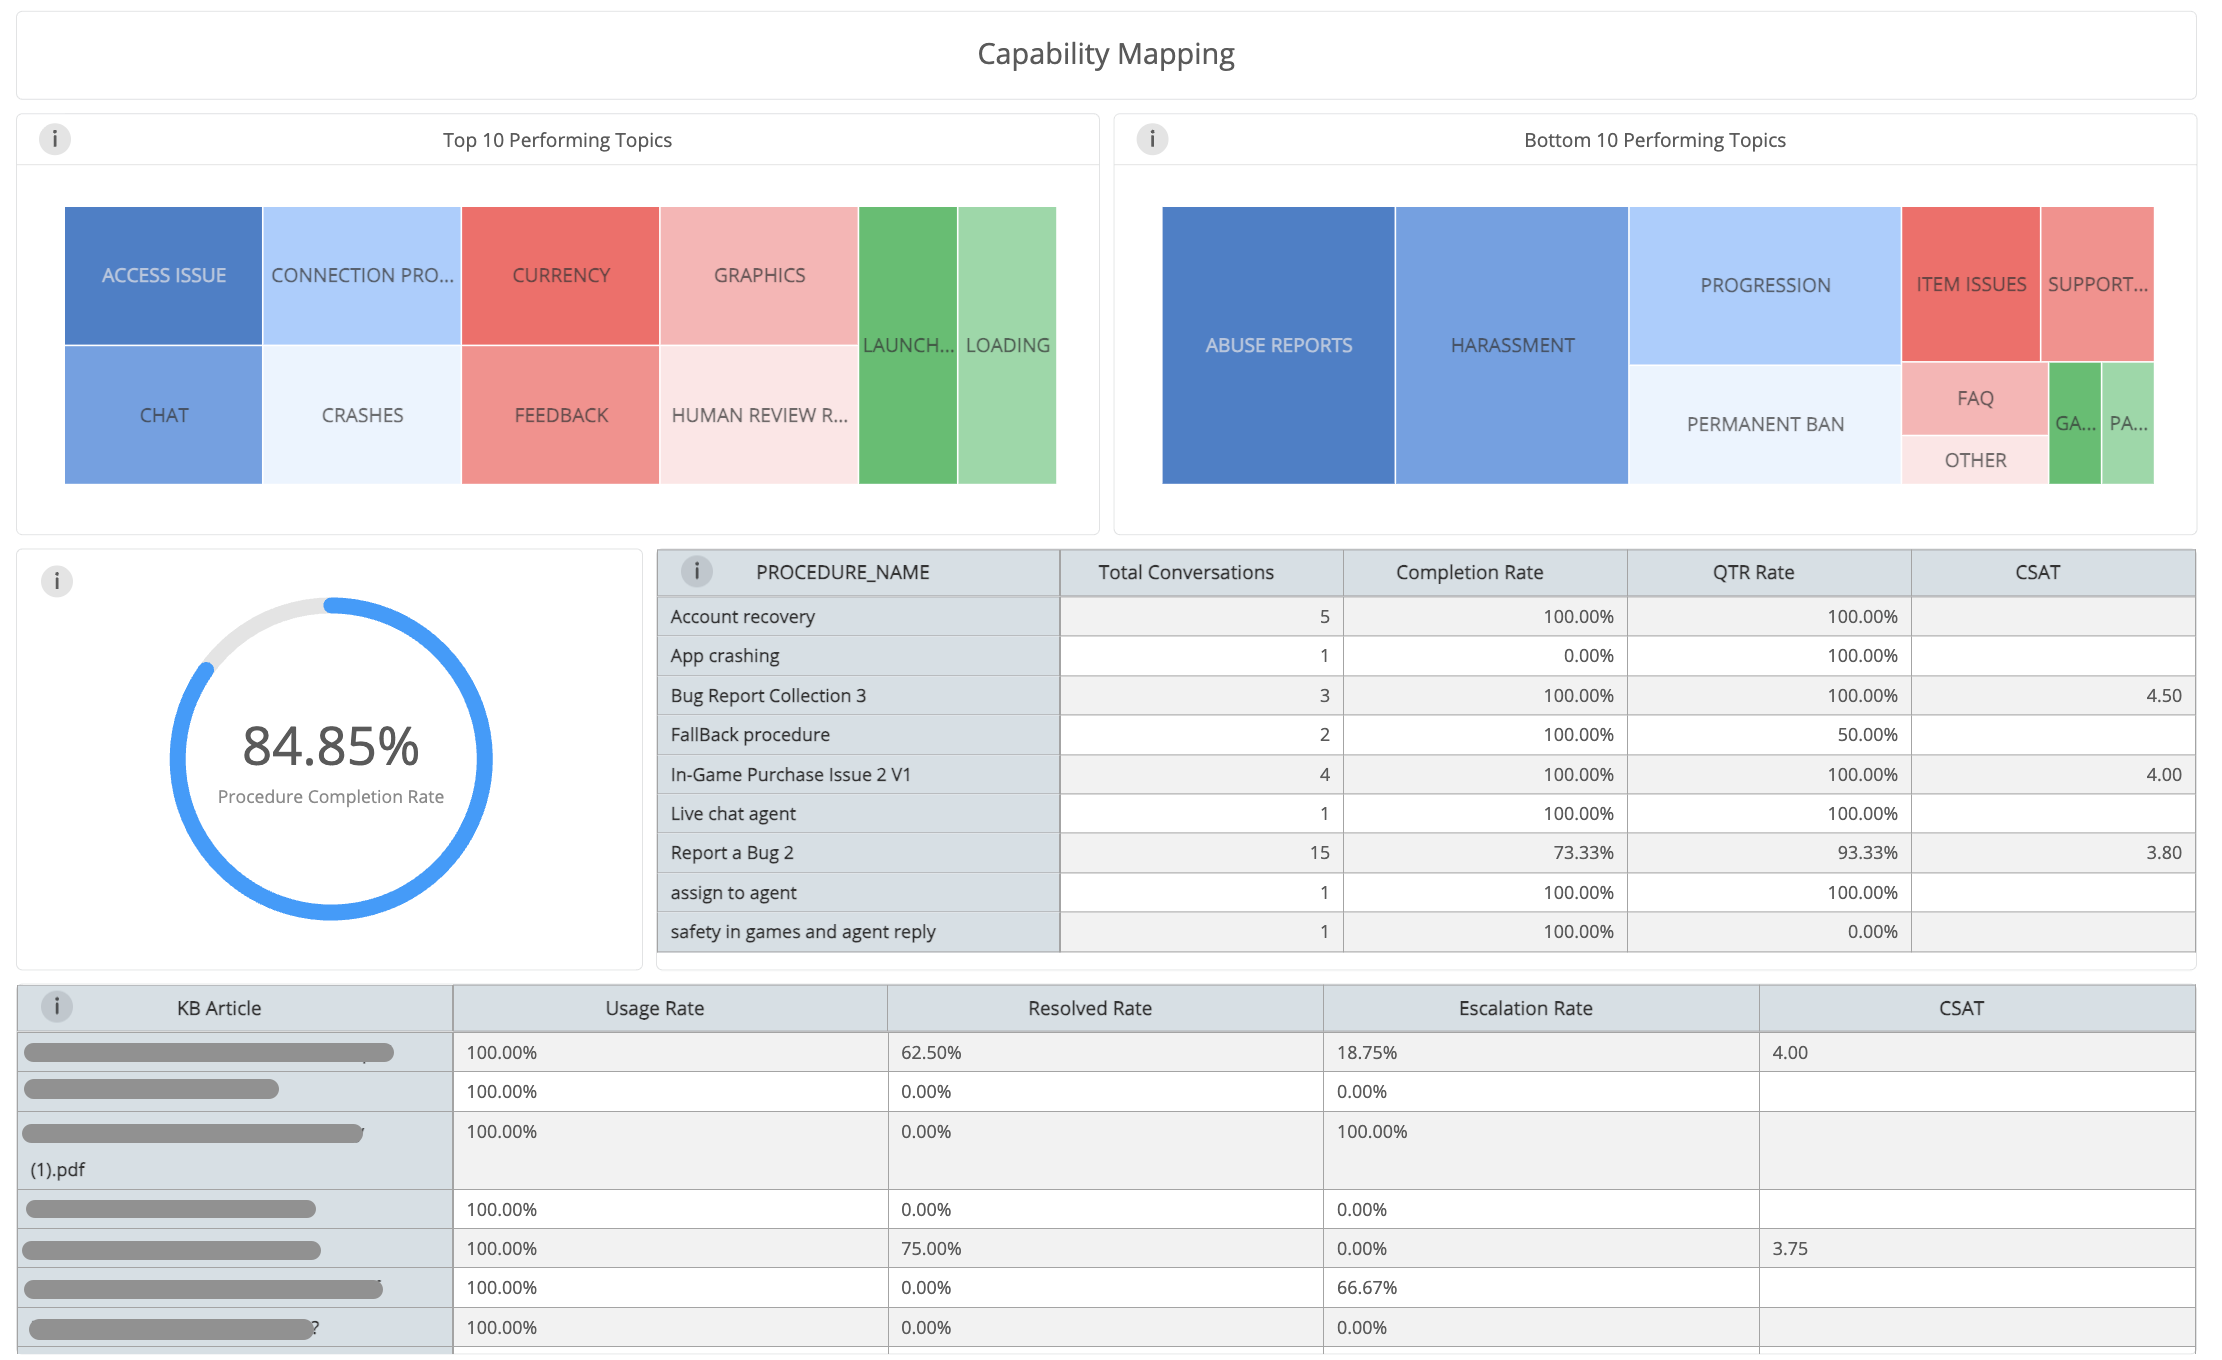
Metrics that can be explored within the Capability Mapping section are Procedure Completion Rate, Top 10 Performing Topics, Bottom 10 Performing Topics, Procedure details, and KB article details.
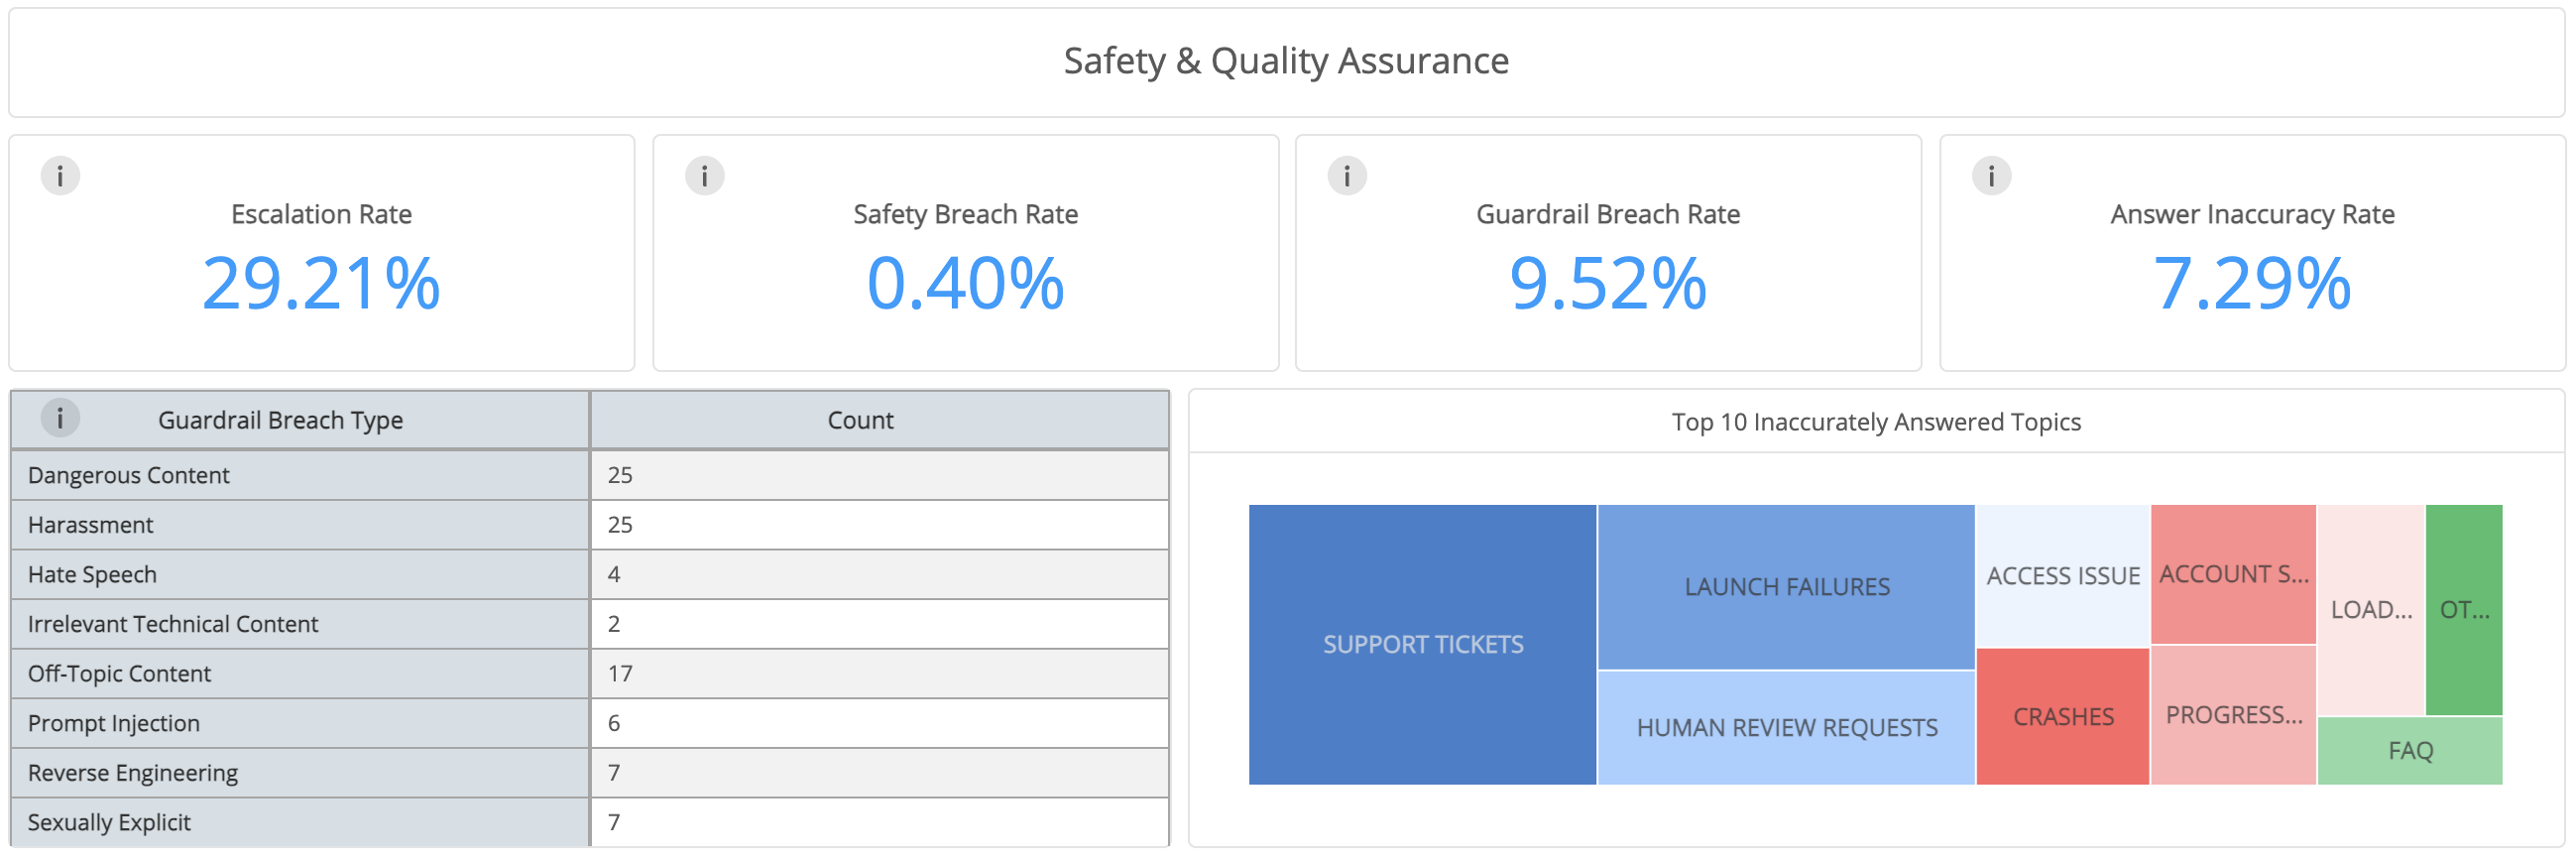
Metrics that can be explored within the Safety & Quality Assurance section are Escalation Rate, Safety Breach Rate, Guardrail Breach Rate, and Answer Inaccuracy Rate.
Detailed information on each metric can be found in Glossary. Additionally, new metrics have been introduced for the AI Agent Performance Analytics report. Please refer to the table below for more details:
| Metric | What does it measure? | How do we calculate it? |
| Total Ticket | The total number of tickets created during the selected reporting period. | Count of all tickets created within the selected reporting period. |
| Intended outcome rate | The percentage of AI-involved tickets that reached an intended outcome, either through a qualified ticket resolution or an appropriate escalation based on configured procedures, guardrails, or fallback instructions. | Qualified Ticket Resolution + System triggered escalations (guardrail breach escalations) + fallback escalation (fallback escalation or global fallback should not be considered) + escalations as per configured instructions/procedures/Total AI involved tickets |
| Qualified ticket resolutions (abs no) | The total number of tickets the AI successfully resolved end-to-end without requiring a human handoff, receiving negative feedback, or being immediately reopened. | Total AI-involved tickets − Disqualified tickets A ticket is disqualified if any of the following conditions is met:
|
| Qualified Ticket Resolution Rate | The percentage of AI-involved tickets that the Care AI Agent successfully resolved end-to-end without requiring human intervention, receiving negative feedback, or being reopened immediately after resolution, according to the configured qualification criteria. | (Number of Qualified Ticket Resolutions / Total AI-Involved Tickets) × 100 |
| Messages per Resolution | The average number of user and AI Agent messages exchanged in tickets successfully resolved by the Care AI Agent, providing insight into the conversational effort required to achieve a resolution. | Total number of user and AI Agent messages across Qualified Ticket Resolution tickets / Total number of Qualified Ticket Resolution tickets Note: This will only be available and calculated after a ticket is marked as resolved and 48 hours have passed |
| Top Performing Topics | Highlights the top 10 topics with the highest Qualified Ticket Resolution (QTR) Rates, helping identify the topics for which the Care AI Agent is most effective at resolving customer issues. | Topics are ranked by their Qualified Ticket Resolution (QTR) Rates in descending order. The top 10 topics with the highest rates are displayed along with their respective QTR Rates. |
| Top Underperforming Topics | Highlights the 10 topics with the lowest Qualified Ticket Resolution (QTR) Rates, helping identify areas where the Care AI Agent may require improvements to its knowledge coverage, instructions, or configured workflows. | Topics are ranked by their Qualified Ticket Resolution (QTR) Rates in ascending order. The 10 topics with the lowest rates are displayed along with their respective QTR Rates. |
| Procedure Completion Rate (Process Gap) | The percentage of procedure triggered tickets where procedure was successfully executed completely. | (Number of tickets in which an initiated Procedure was successfully completed / Total number of tickets in which a Procedure was triggered) × 100 |
| Procedure Analytics | This provides procedure level analytics for each procedure that is mapped with Live AI Agent | Procedure-level analytics are calculated using the following metrics for each Procedure mapped to a live Care AI Agent:
Note: We get this information post a done stage(issue is resolved), so this metrics is not immediately available |
| Answer Inaccuracy Rate | The percentage of AI involved tickets where AI provided inaccurate responses. | (Number of AI Agent messages identified as inaccurate / Total number of AI Agent messages) × 100 |
| Escalation rate | The percentage of AI-handled tickets that ultimately required a human agent to step in and finish the job. | (Number of AI-involved tickets with at least one human agent response / Total number of AI-involved tickets) × 100 |
| Safety breaches by AI agent | The percentage of AI-handled tickets where the AI generated unsafe content, harmful advice, or violated brand policies. | (Number of AI-involved tickets in which unsafe content or policy violations were detected in AI Agent responses / Total number of AI-involved tickets) × 100 |
| Guardrails Breach Rate | The % of guardrail breaches out of total AI agent involved issues | (Number of unique AI-involved tickets with at least one guardrail breach / Total number of AI-involved tickets) × 100 |
| Guardrails Breach type share | For each guardrails breach type, provide the following metric: No. of incidents of specific breach type/Total guardrails breaches | (Number of incidents of a specific guardrail breach type / Total number of guardrail breach incidents) × 100 |
| Top Inaccurately Answered Topics | Identifies topics prone to errors, signaling the need to simplify dense FAQs or merge overlapping content. | Topics are ranked by the number of inaccurate AI Agent responses associated with each topic. The top five topics with the highest volumes are displayed. |
| KB Usage % by AI Agent- Article Wise (FAQs + Documents) | % of AI Agent-Involved issues where this article was used (Issues where AI Agent reply >= 1) | For each of the top 10 knowledge sources (FAQs and documents), the following metrics are provided: A. Article Usage Rate: (Number of AI-involved tickets in which the article was used / Total number of AI-involved tickets) × 100. B. Resolution Rate: (Number of tickets in which the article was used and the ticket was resolved / Number of tickets in which the article was used) × 100. C. Escalation Rate: (Number of tickets in which the article was used and the ticket was escalated / Number of tickets in which the article was used) × 100. D. Average CSAT: Average CSAT score for resolved tickets in which the article was used. |
The information mentioned above is also available in table format. You can also download the data for every table in various formats by clicking on the download option.

For more details, please refer to the Care AI Agent page.
For more details, please refer to the Helpshift Analytics page.
For details of the definition for each metric, please refer to the Glossary page.