
Attribution Measurement Metrics let you go beyond basic delivery metrics and track the impact of your engagement campaigns. By establishing a pre-campaign baseline and measuring user activity against it during a 7-day attribution window, you can accurately validate your campaign's true Return on Investment (ROI) and measure how player behavior changes over time.
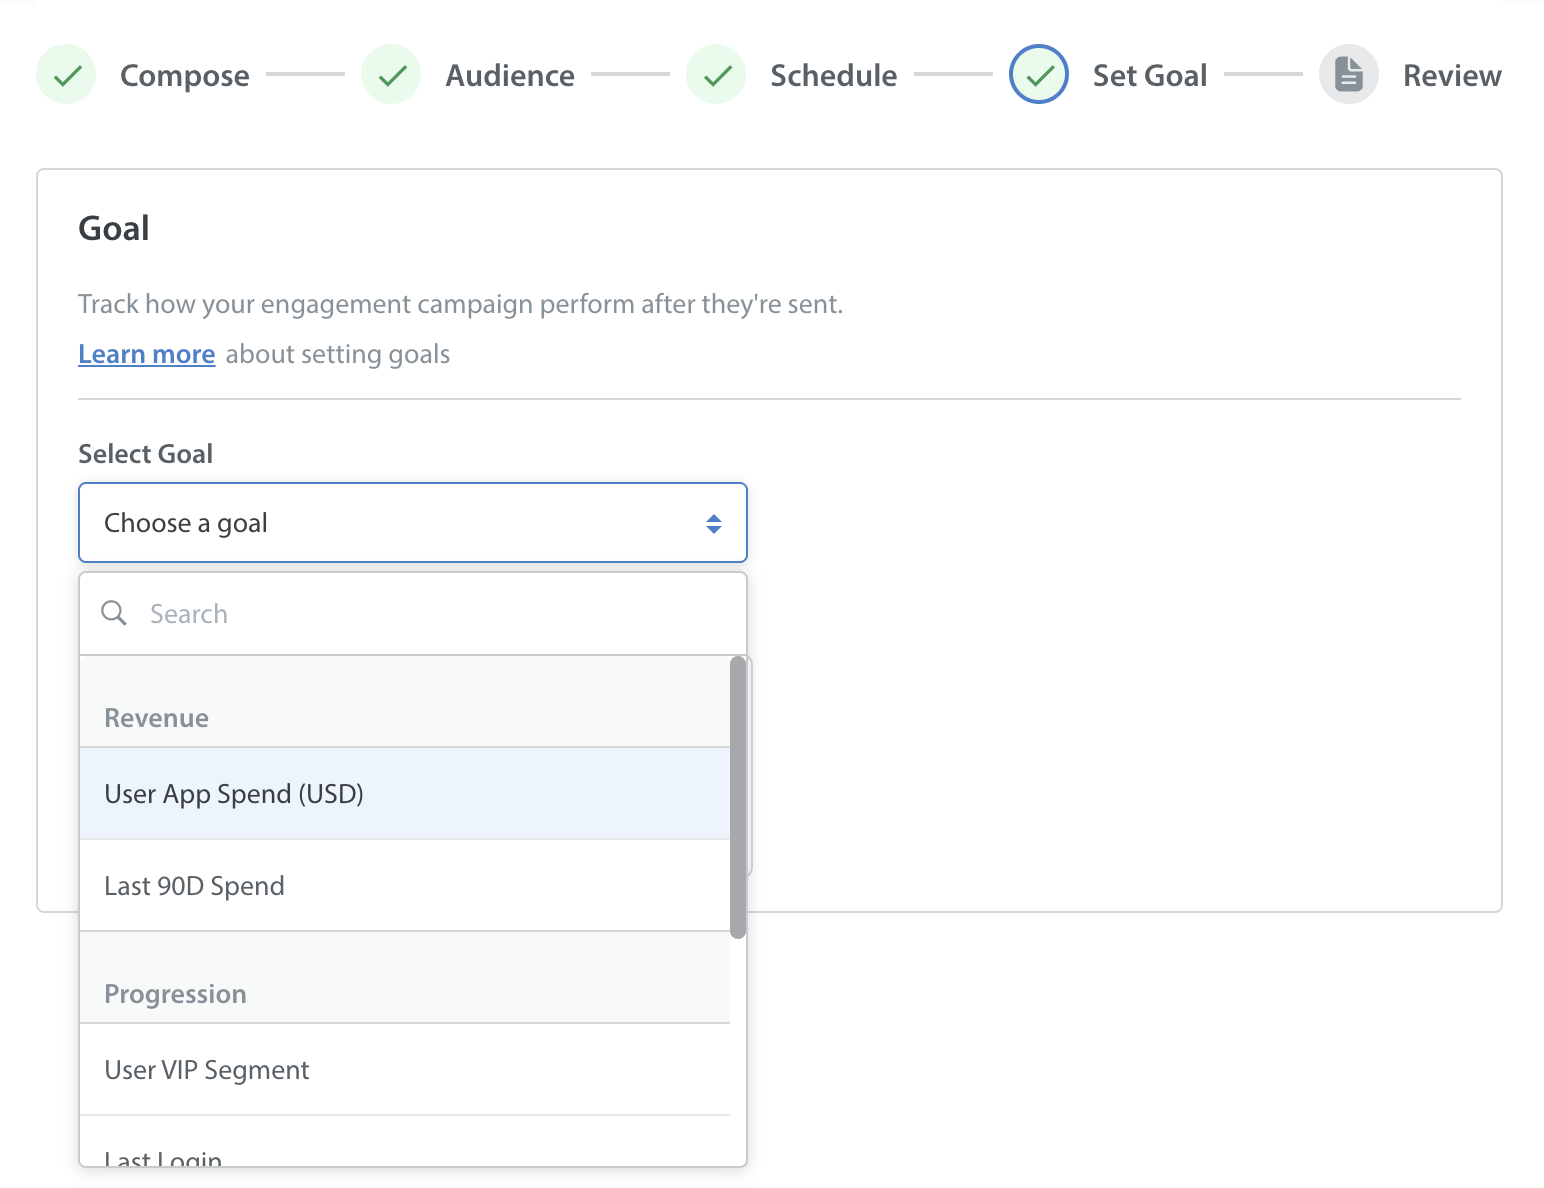
Campaign goals are grouped into three categories based on the type of business outcome you want to measure:
- Engagement: Choose the Engagement goal when your objective is to increase overall user activity within your application.
- Revenue: Choose a Revenue goal when your campaign is designed to increase purchases or user spending.
- Progression: Choose a Progression goal to measure how users progress on any milestone
(eg, User level, VIP Segment) after receiving a campaign.
Goal Categories and App-level User Fields
Note: To use Revenue or Progression goals, you must first integrate the User Hub, as these metrics monitor changes in your standard app-level user fields. Engagement goals are tracked automatically through SDK session logs and only work when the user is logged in via the User Hub API. If the user is logged in via the legacy login API, their session logs will not count toward the goal.
The following table shows the goal categories, goals, and their associated app-level user fields.
| Goal Category | Goal | App-level User Fields |
| Revenue | User App Spend | User App Spend (USD) |
| Revenue | Last 90D Spend | Last 90D Spend |
| Progression | User VIP Segment | User VIP Segment |
| Progression | Last Login Date | Last Login Date |
| Progression | Last Purchase Date | Last Purchase Date |
| Progression | Count of Transactions | Count of Transactions (90D) |
| Progression | Count of Refunds | Count of Refunds (90D) |
| Progression | User App Rating | User App Rating |
Attribution Metric Glossary
Before exploring the specific goals, use this glossary to understand the key components of the Goal Performance dashboard cards and charts.
| Component | Term | Description |
| Card | Current Value | The absolute metric value achieved by your delivered player base at the end of the selected attribution window (e.g., at Day 7). |
| Card | Percentage Change | It is the mathematical difference between your starting baseline and the current active value, indicated by a green up-arrow (▲) for growth or a red down-arrow (▼) for reduction. |
| Card | Baseline Value | This represents the initial value (pre-campaign) of the metric. For user attributes of revenue and progression goals (like VIP Segment), this is taken at the exact moment the campaign is sent. For the Engagement goal session data, it reflects the user's historical average over the 7 days prior to the campaign. |
| Chart | Grey Bar | Represents the Baseline: the value of the field at the exact moment the campaign was sent. |
| Chart | Colored Bars | Display the Current Value of the field at intervals (24H, 3D, 5D, 7D) following the campaign. |
| Chart | Line Graph | Visualizes the Delta over time, showing how the percentage change relative to the baseline progressed throughout the window. |
Engagement
Choose an Engagement goal when your objective is to increase overall user engagement and retention within your application.
The following goal is available.
Engagement
Selected by default, the Engagement metric measures overall user engagement after the campaign is delivered. Use this goal to understand whether users become more active within your application during the attribution period.
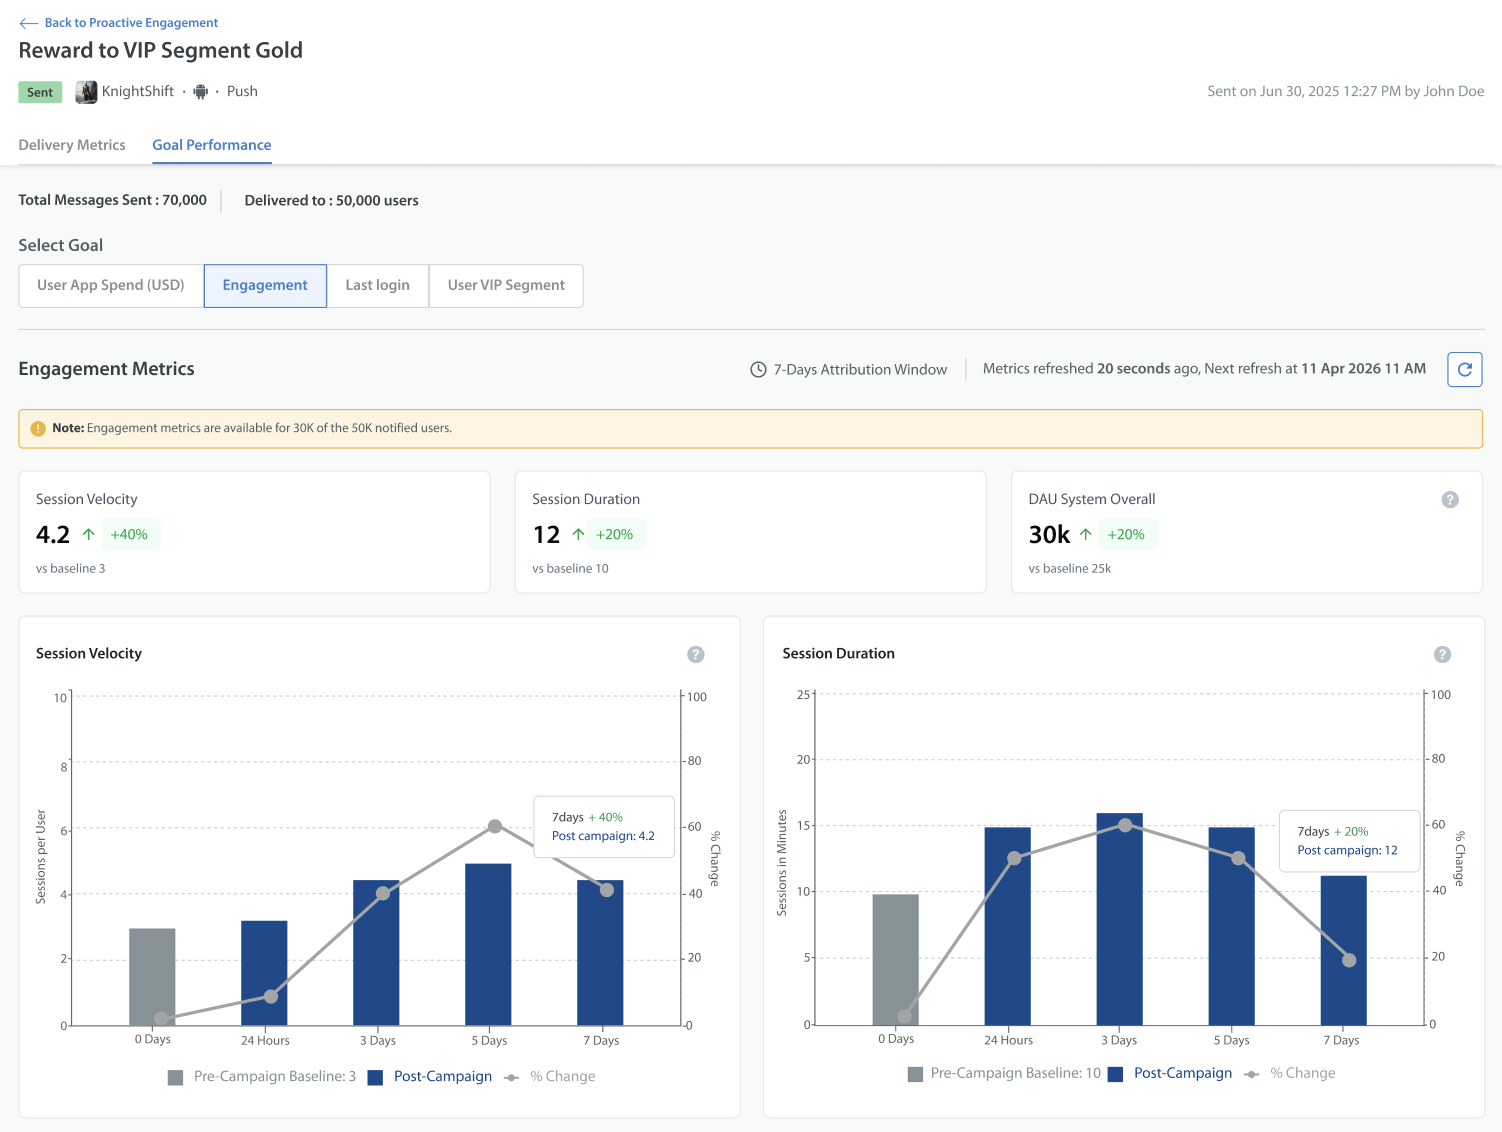
An engagement campaign is sent to players. Historically, players average 3 sessions per day (Baseline). By Day 7 of the campaign, they are averaging 4.2 sessions per day (+40% progress). Their average session duration has increased from 10 to 12 minutes (20% progress), and the app-wide Daily Active Users (DAU) have grown by 20%.
| Goal & Metric | Cards Displayed | Charts Displayed |
Engagement |
|
|
Note: For Engagement metrics, only users logged in via the new User Hub login API are counted. Players logged in via legacy login APIs are excluded from the calculation.
Revenue
Choose a Revenue goal when your campaign is designed to increase purchases or user spending.
Examples include:
- Promoting in-app purchases
- Running limited-time offers
- Encouraging premium upgrades
- Driving purchases from high-value users
The following goals are available.
User App Spend
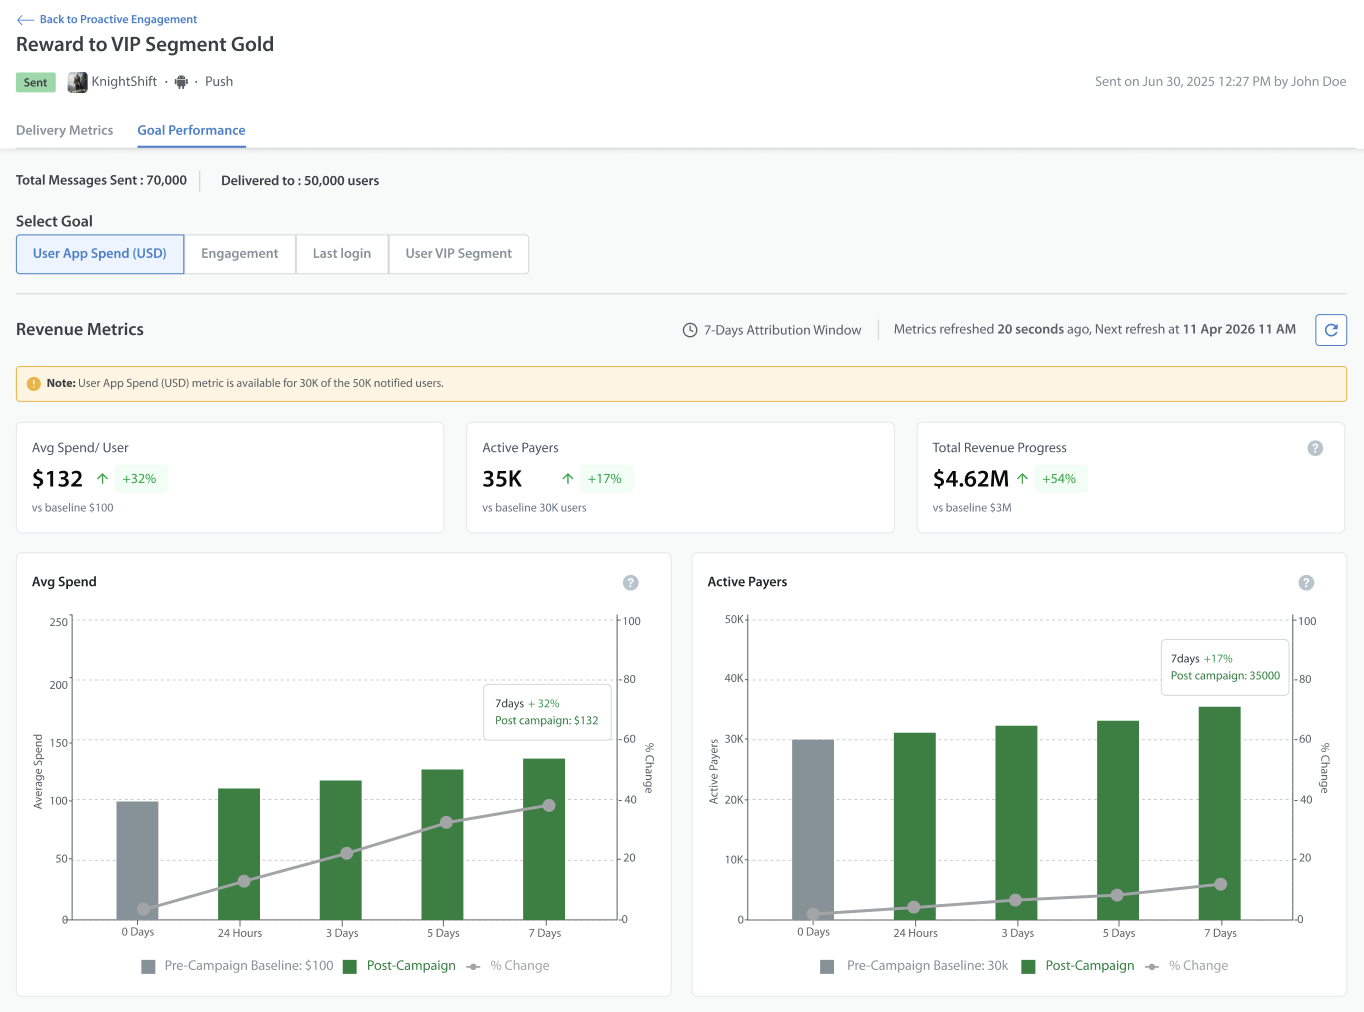
Measures changes in the amount users spend within your application after receiving the message. Use this metric to evaluate whether your campaign encouraged additional purchases.
Last 90D Spend
Measures changes in a user's cumulative spending over the last 90 days within your application.
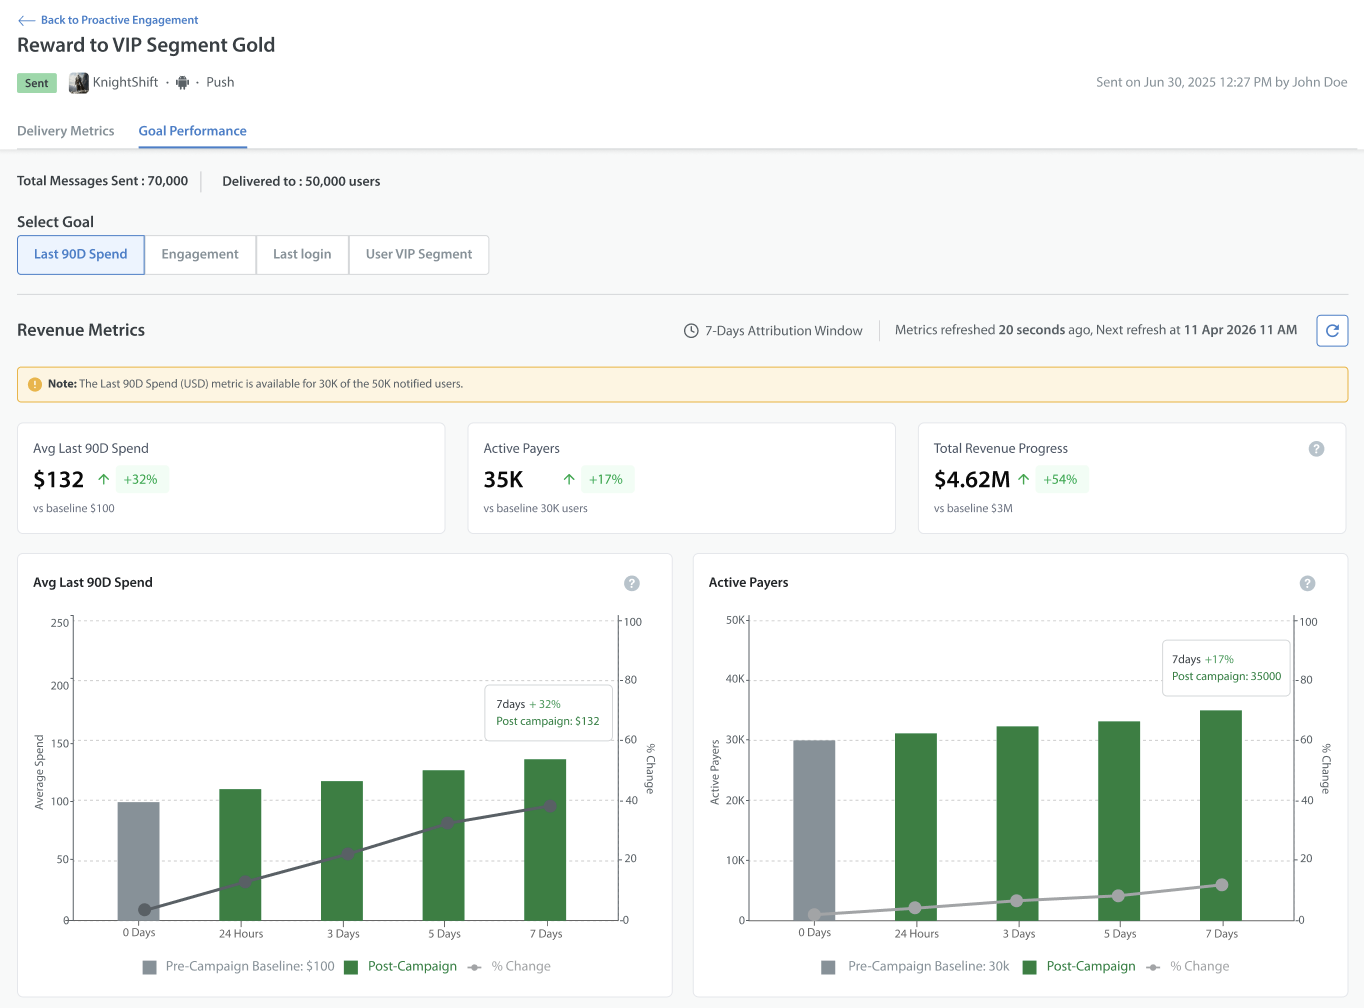
A campaign is sent to 50,000 players with the goal of increasing revenue. At send time, the average spend per player is $100. On Day 7, the average spend has increased to $132 (+32% progress), and the number of active payers has climbed to 35,000. Total 90D revenue has increased from $3M to $4.62M, reflecting progress.
| Goal & Metric | Cards Displayed | Charts Displayed |
| User App Spend (USD) |
|
|
| Last 90D Spend |
|
|
Progression
Choose a Progression goal to measure how users progress (eg, VIP Segment, Count of Transactions) after receiving a campaign. These metrics help determine whether users return to the app, complete purchases, advance to higher-value segments, or improve overall satisfaction.
The following goals are available.
User VIP Segment
Tracks changes in a user's VIP segment after the campaign to monitor progression into higher-value customer segments.
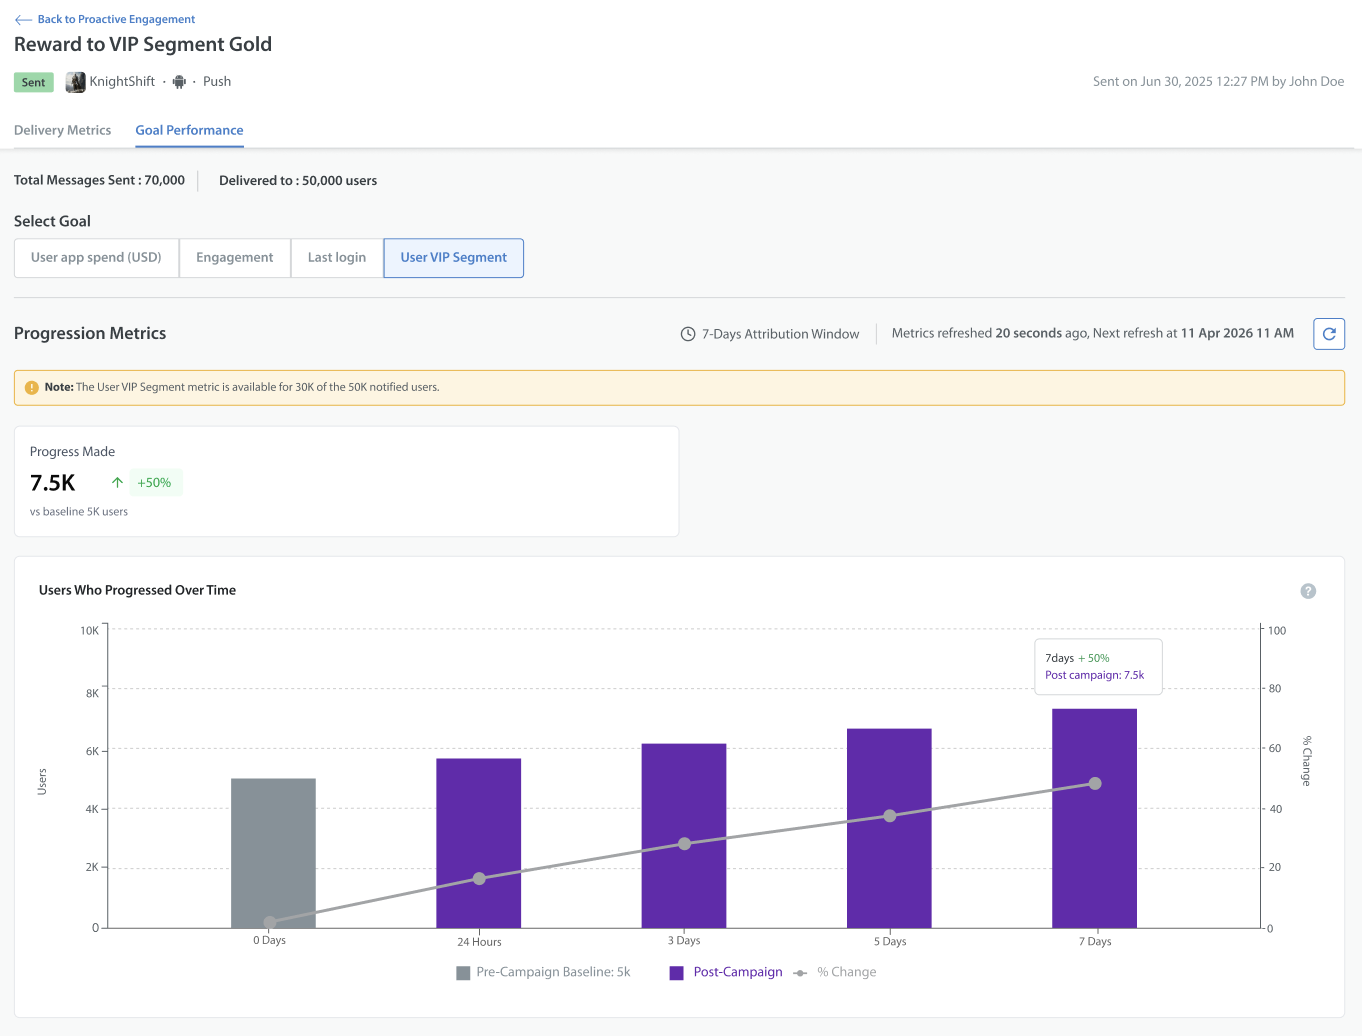
You send a "Milestone Rewards" message to players close to leveling up. The baseline shows that 5,000 players are already in the VIP bracket. By Day 7, the card shows 7500 players have progressed (+50% progress), proving the campaign directly accelerated player progression.
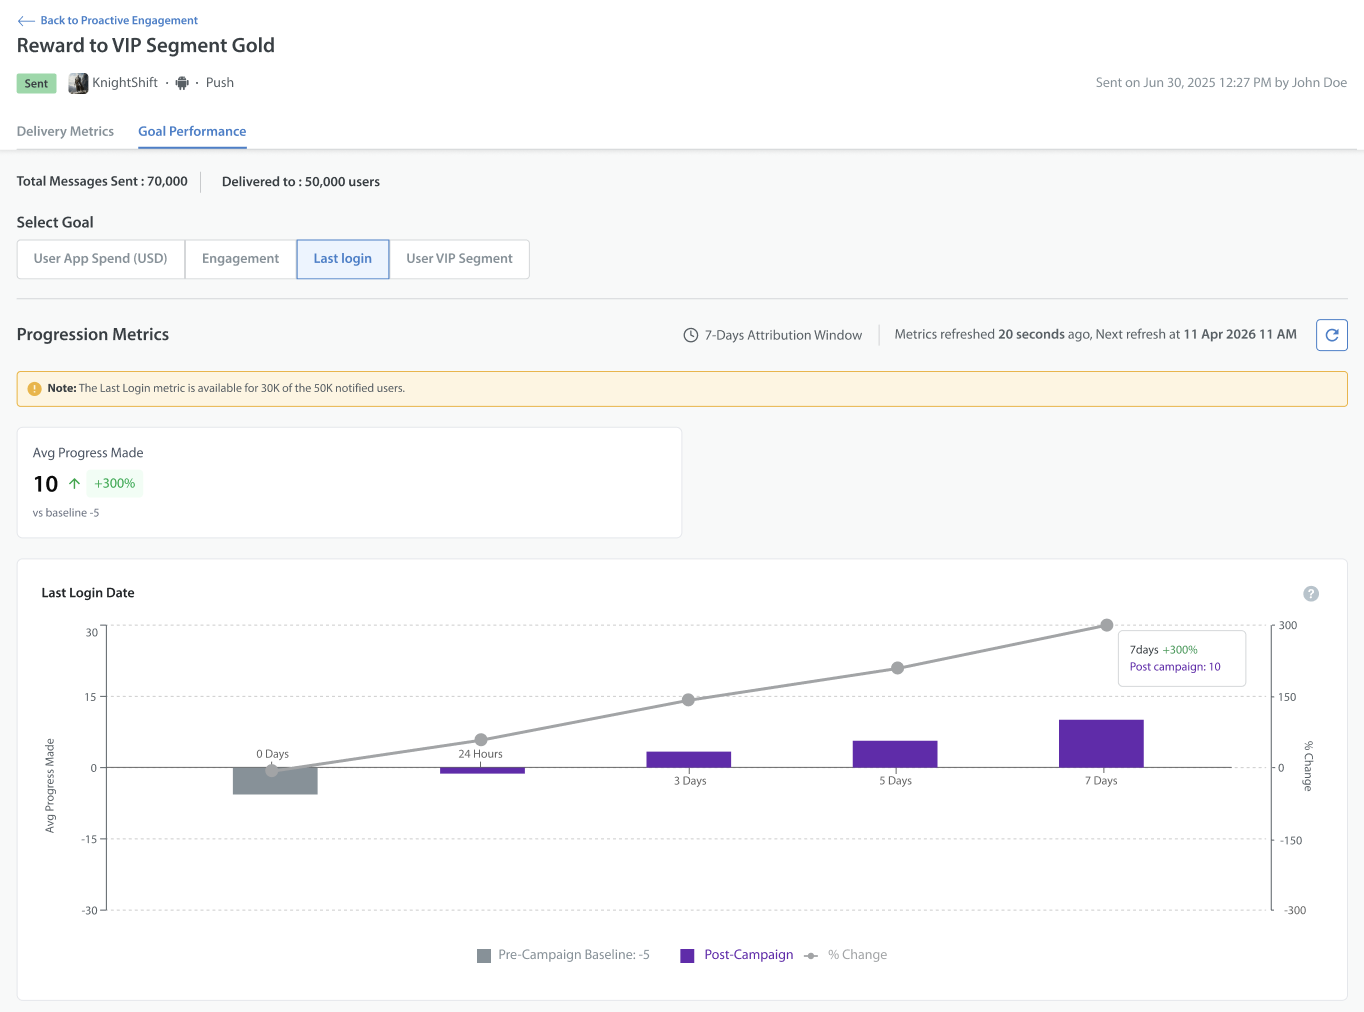
Last Login
Tracks whether users returned to your application after receiving the campaign to measure user re-engagement.
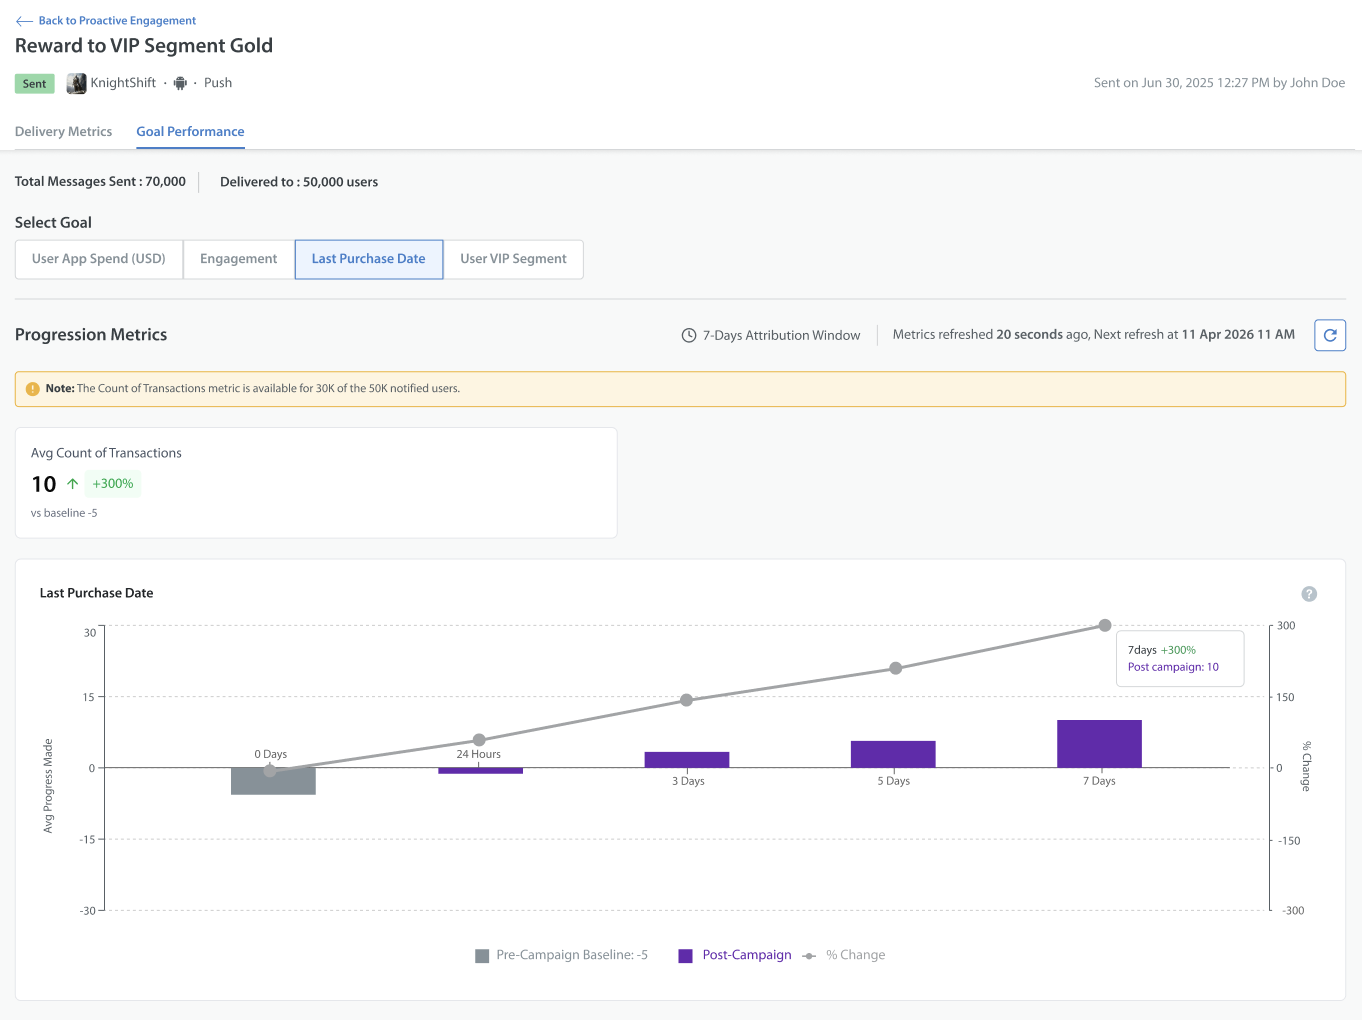
Last Purchase Date
This metric helps determine whether the campaign encouraged users to make a purchase after receiving it.
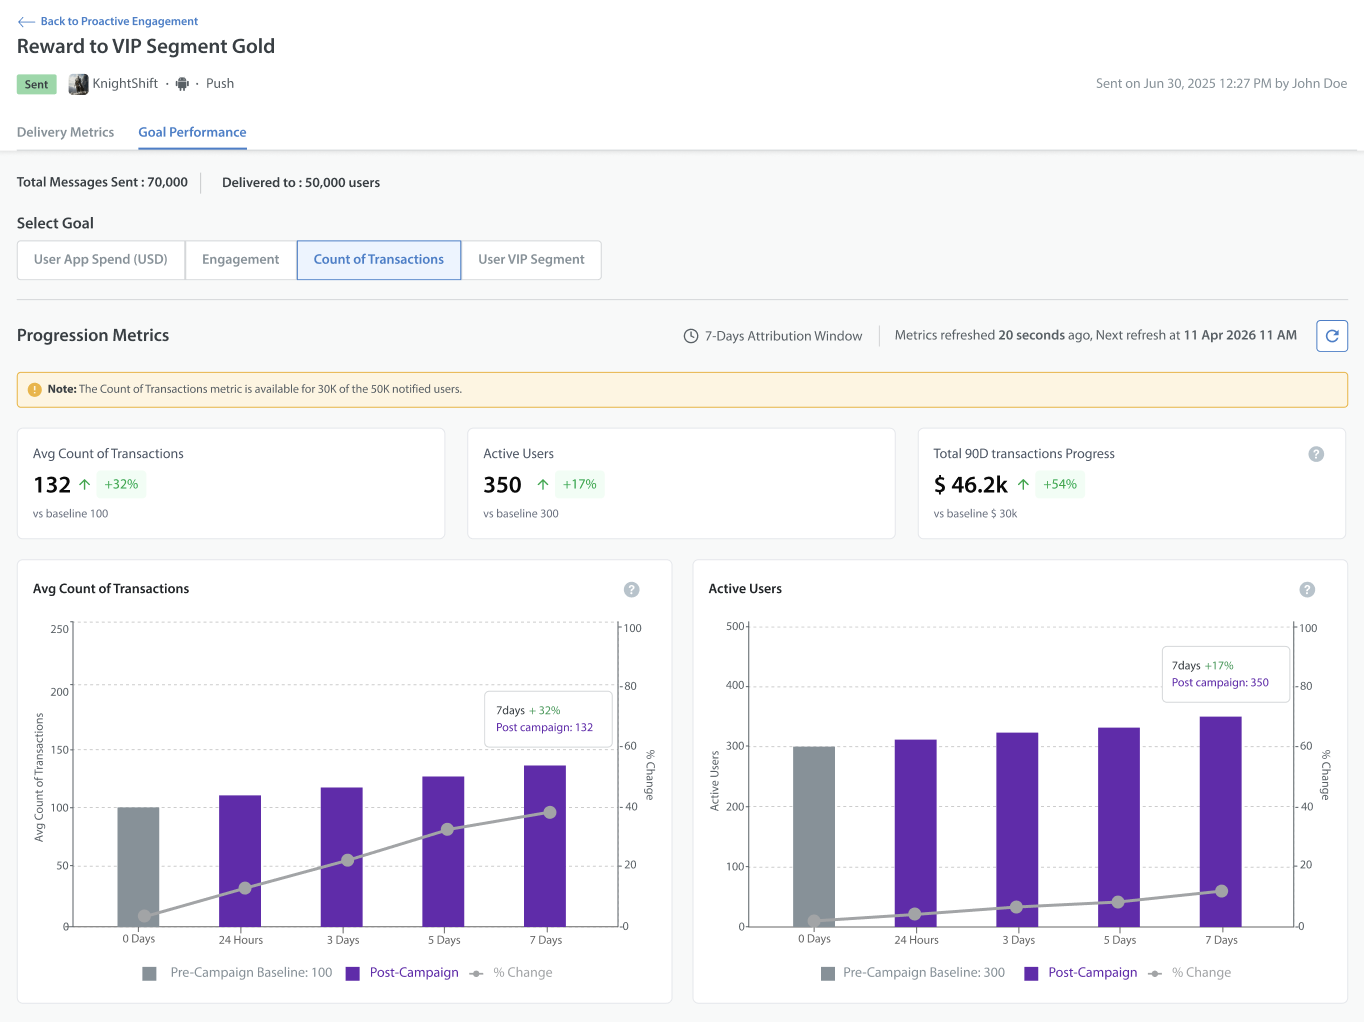
Count of Transactions
Tracks changes in transaction counts from the pre-campaign baseline and over the attribution period. Use this metric to evaluate whether the campaign increased purchase frequency.
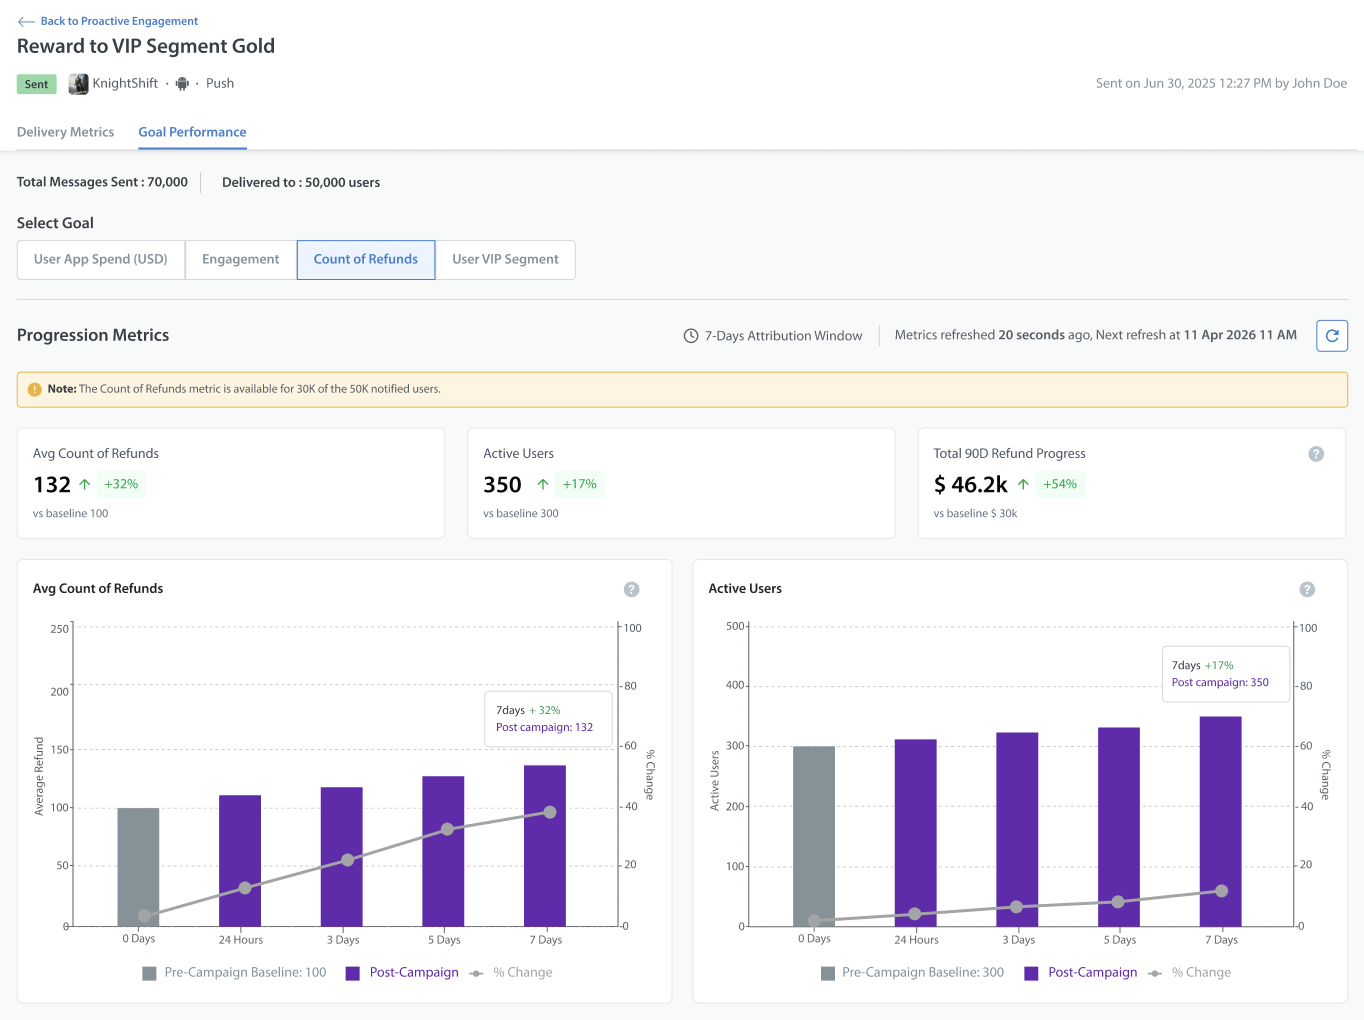
Count of Refunds
Tracks changes in refund counts from the pre-campaign baseline and over the attribution period. This metric can help identify changes in refund activity following a campaign.
User App Rating
This metric helps evaluate whether the campaign influenced user satisfaction by measuring the changes in user ratings submitted after the campaign.
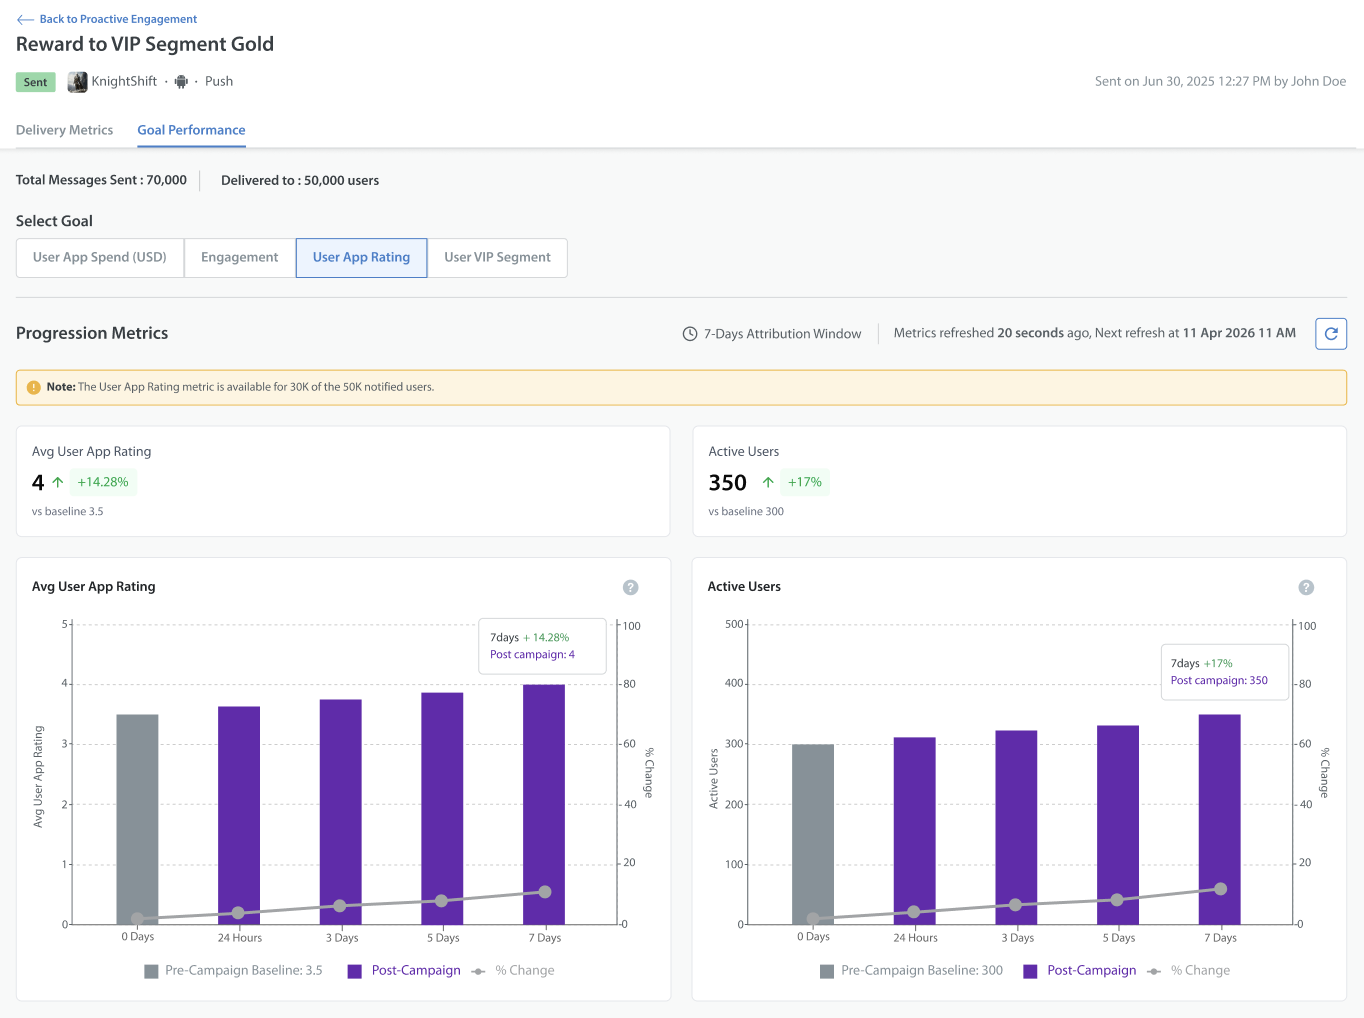
| Goal & Metric | Cards Displayed | Charts Displayed |
| User VIP Segment | Progress Made: The count of unique players who advanced to a new VIP segment during the attribution window. | Users Who Progressed Over Time: The count of players transitioning into higher VIP segments at 24 hours, 3 days, 5 days, and 7 days. |
| Last Login | Avg Progress Made: Average change in the count of days since the last login for the audience. | Last Login Date: Average progress made across the 7-day window. |
| Last Purchase Date | Avg Count of Transactions: The average count of transactions since the last purchase for the campaign audience. | Last Purchase Date: The timeline of purchase intervals. |
| Count of Transactions |
|
|
| Count of Refunds |
|
|
| User App Rating |
|
|