
Custom Reports provide an interactive workspace where you can connect to your data, explore patterns, build visualizations, and share insights with your team. No SQL or technical expertise is required. Using pre-built templates allows you to rapidly deploy best-practice dashboards and customize them to fit your specific needs.
This guide outlines the steps to build tailored reports, how to view them, and best practices for configuring your templates.
Note: Custom Analytics is only available to customers who have the feature enabled for their domain. Additionally, only Admins with a Designer license can create and edit reports, while those with a Viewer license have read-only access.
Understanding Report Modes
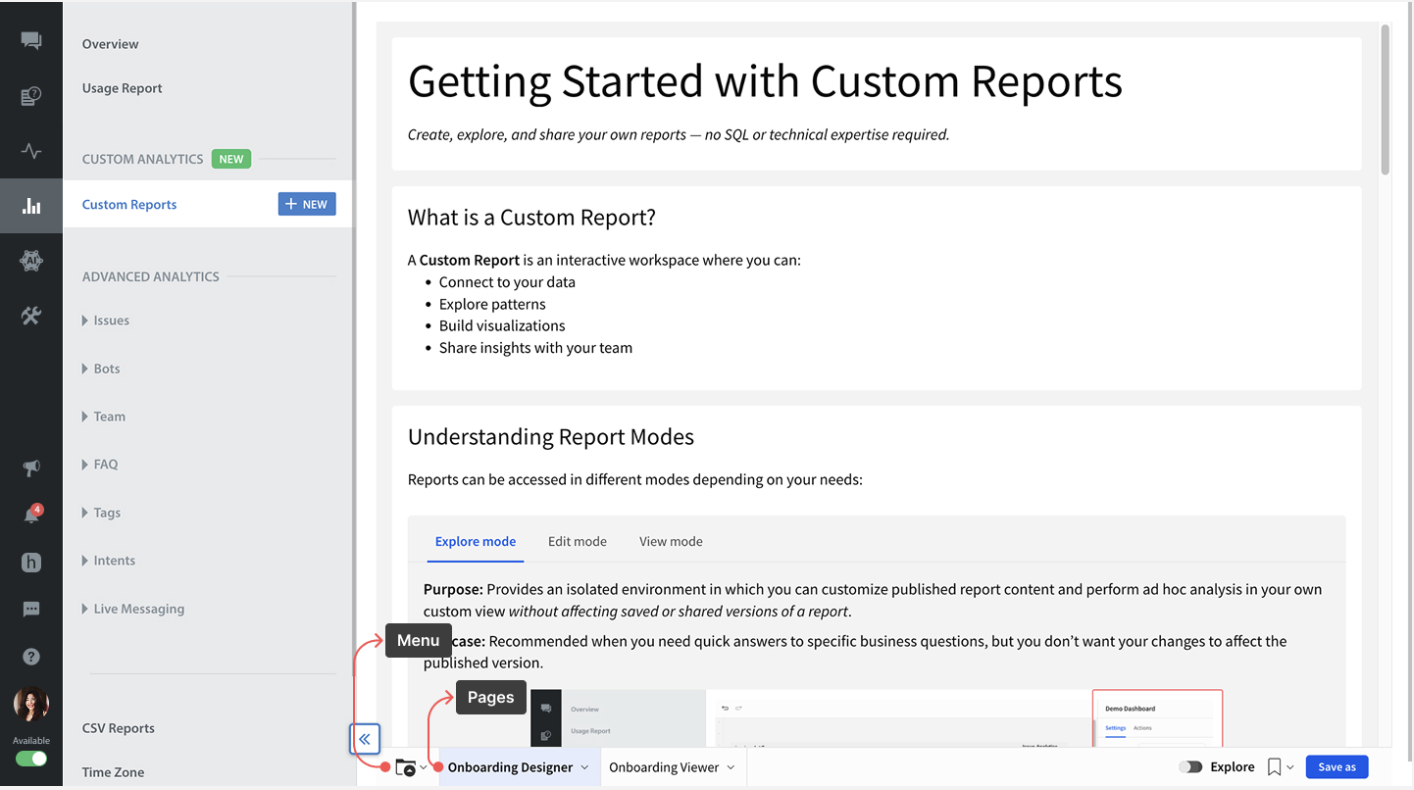
Depending on your needs, you can access and interact with reports in three different modes:
- Explore Mode: Allows you to explore and customize report data in a private workspace without changing the shared or saved reports. You can use this mode for finding quick answers to business questions without impacting the original report. To start editing in this mode, turn on the Explore toggle in the bottom right corner.
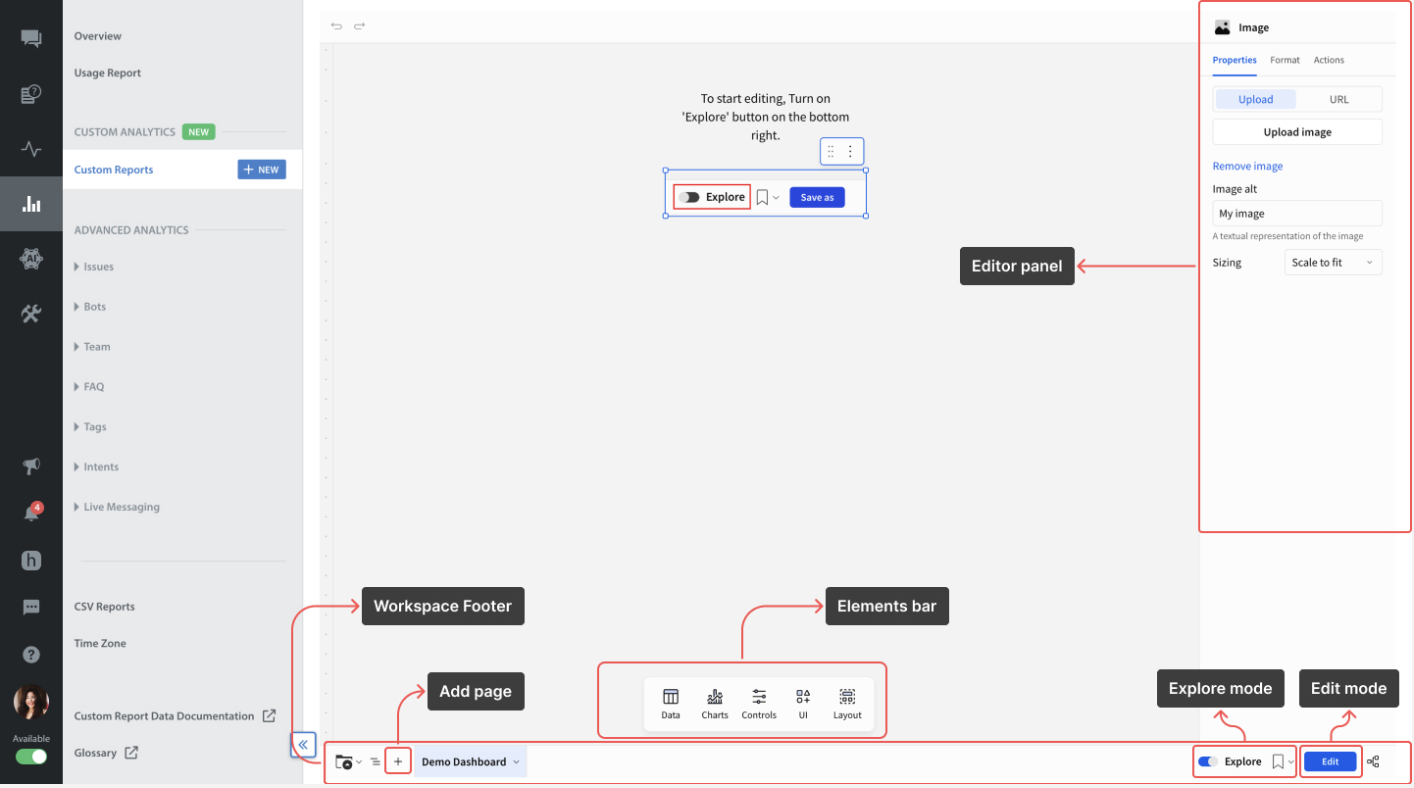
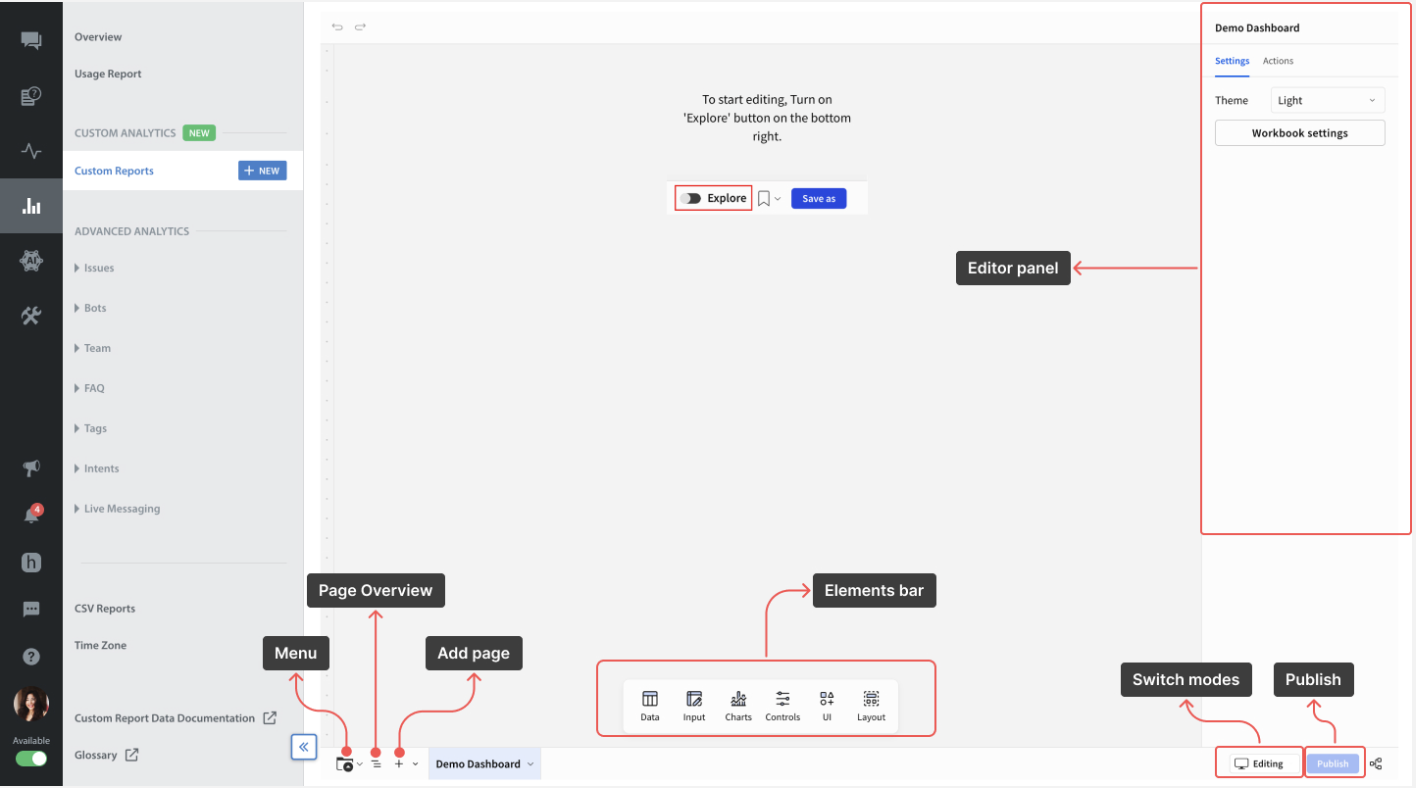
- Edit Mode: Provides a full-featured workspace for creating, editing, and saving reports. Saving and publishing here updates the original report. You can use this mode to build reports you plan to save or share with your team. Saving and publishing here will update the report for everyone.
- View Mode: Allows you to view the published report. You can use this mode when you need to review data and insights without performing additional analysis.
Custom Analytics Template Controls
For template reports, you can access the key controls below from the top-right corner of the template.
| Controls | Description |
| Click for Insights | Provides key insights from all templates, filtered by your selected date range. |
| Homepage | Redirects to the Homepage to view all available templates. |
| Reset | Reset all the filters to their default settings. The date range will be set to the last 30 days as the default setting. |
Creating Custom Reports
You can create a custom report in custom analytics by following the steps below:
To create a copy of the report template, follow these steps:
- Log in to your Helpshift domain as an administrator.
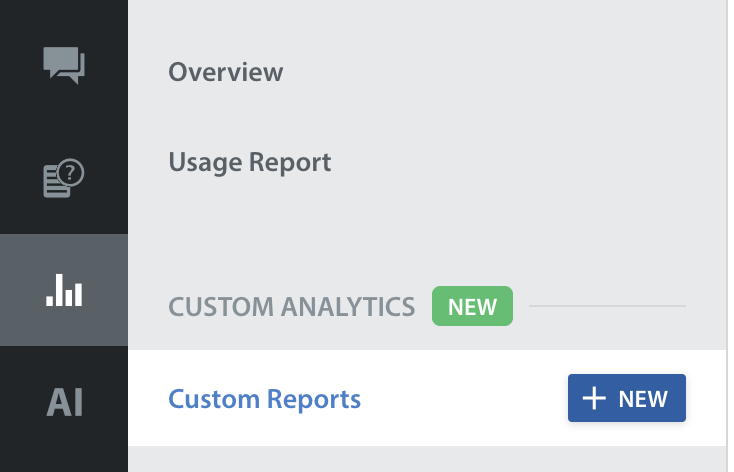
- Navigate to Analytics.
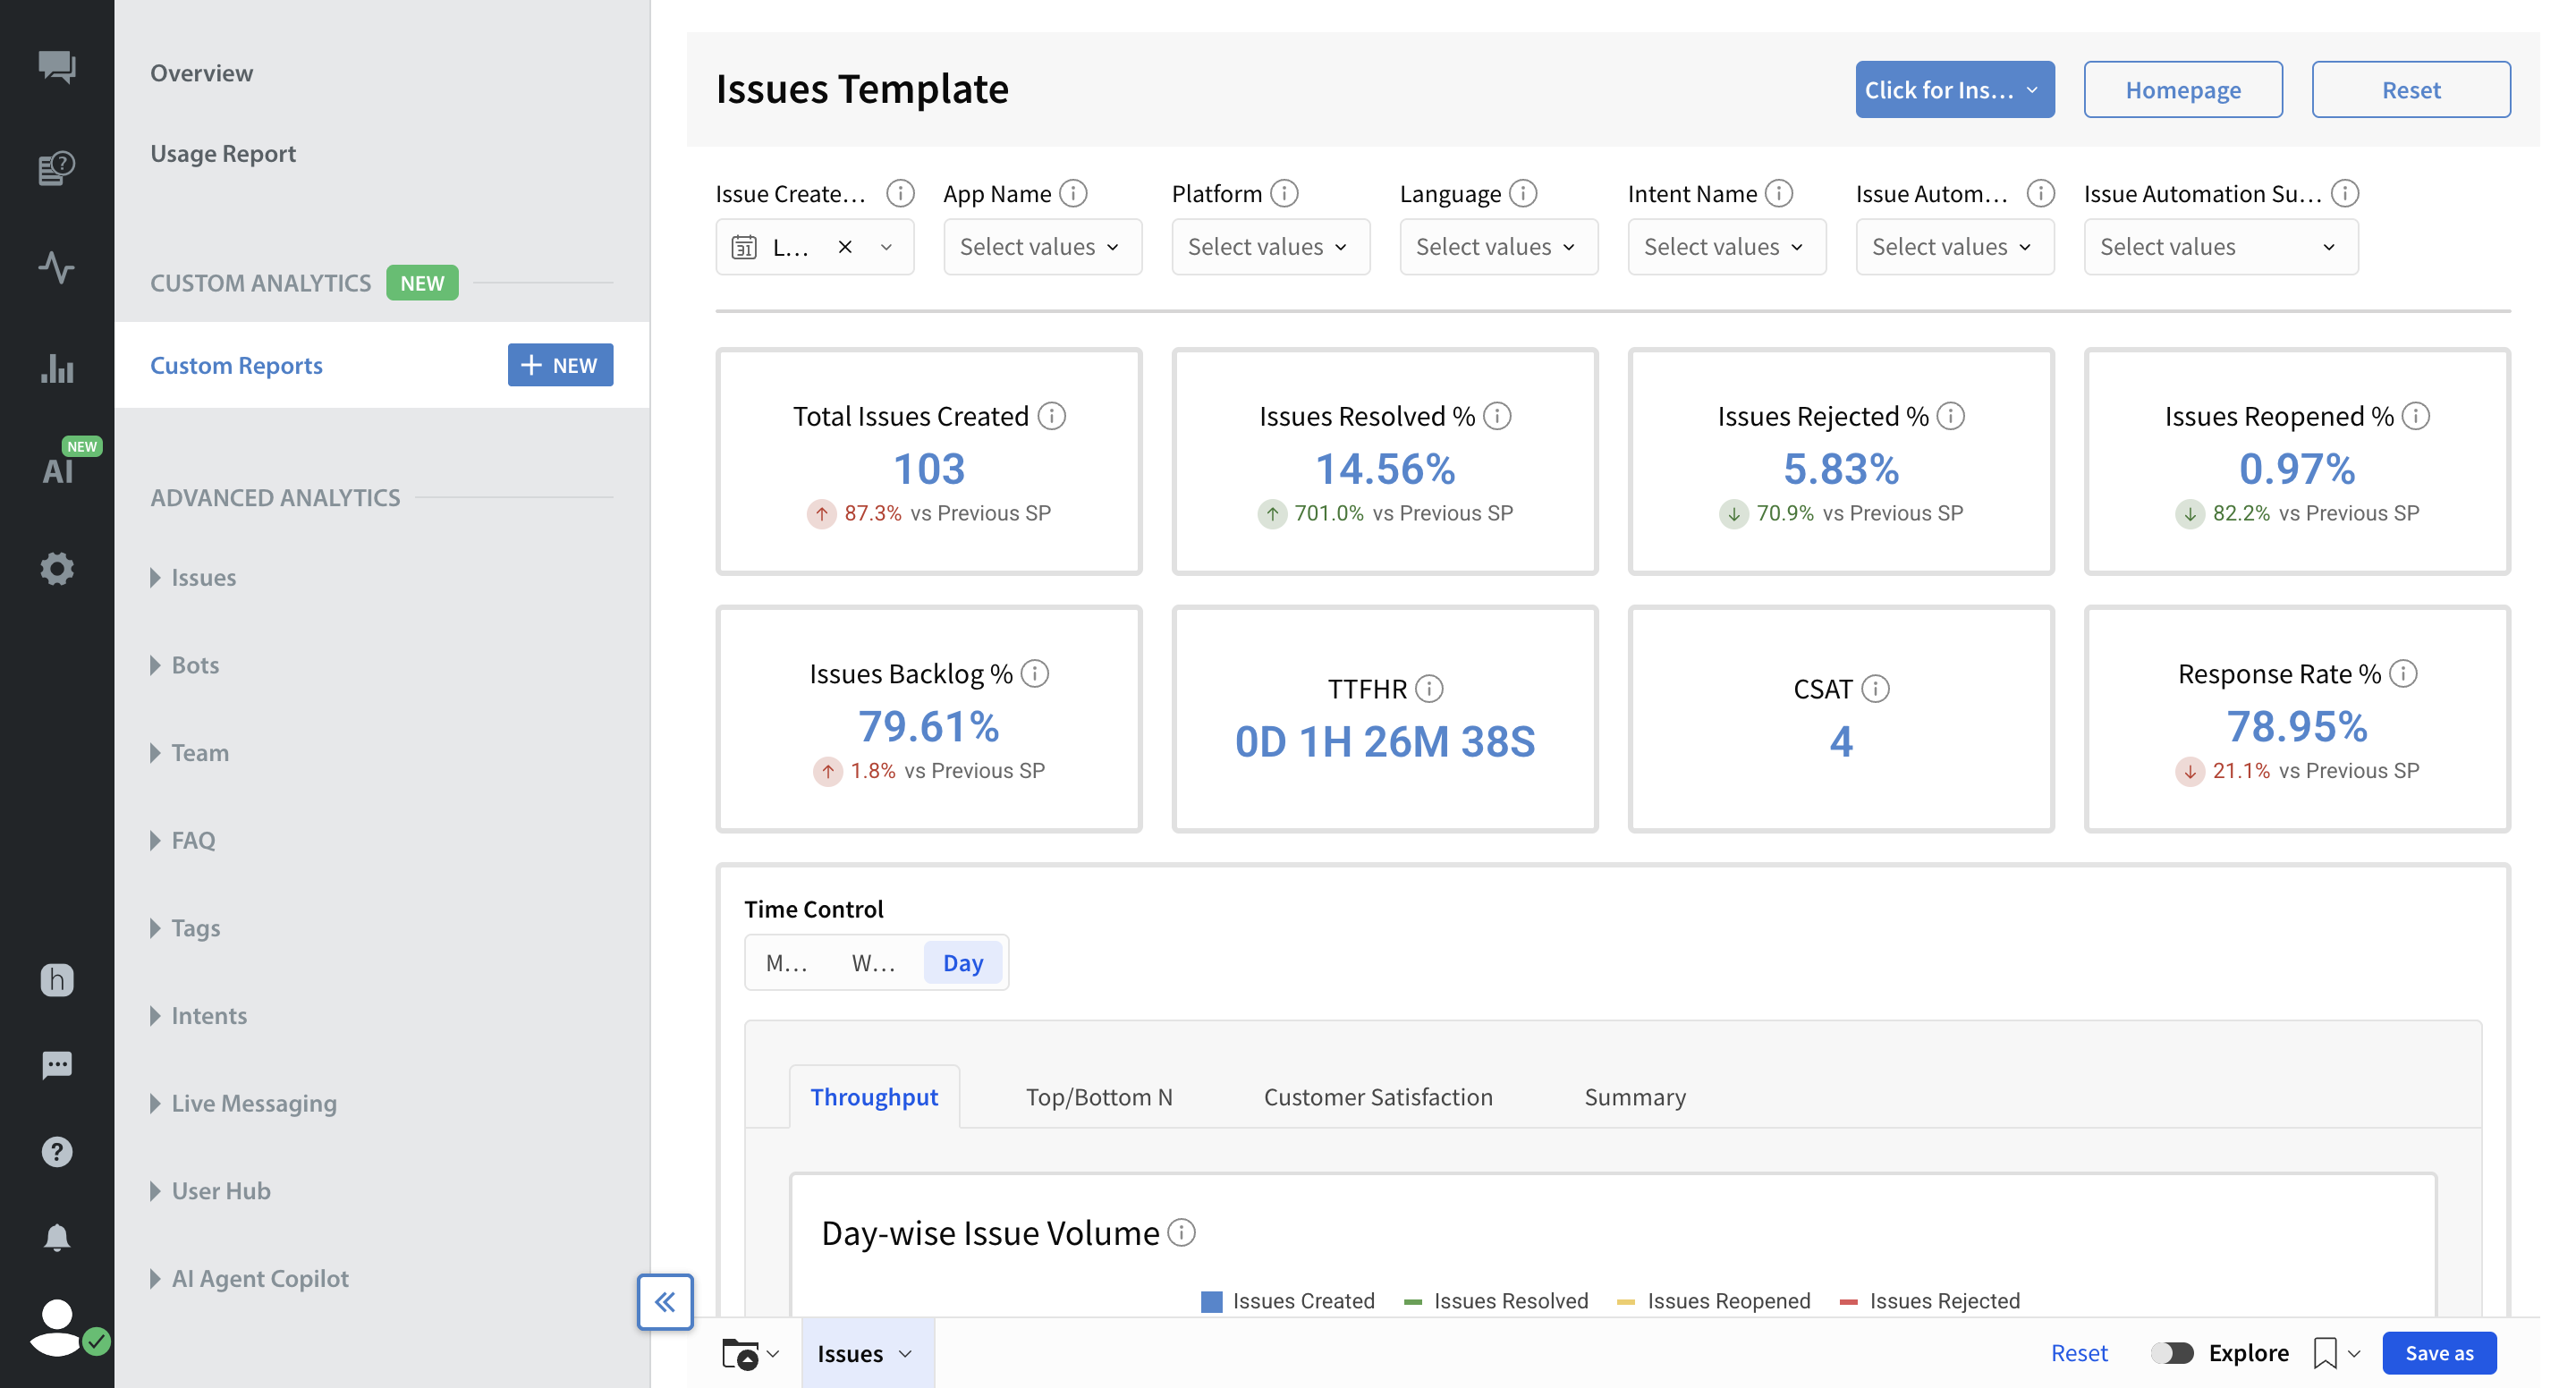
- Under CUSTOM ANALYTICS, click + NEW on the Custom Reports tab.
The template page appears where you can start building reports.
- Choose a template on the Homepage and open any of them.
Note: While Custom Analytics provides 7 preset templates (such as Apps, Bots, Issues, Players, Teams, Interactions, and FAQs) that allow you to deploy best-practice reports instantly, you are not limited to these options. If you prefer to build reports entirely from scratch using data, you have the flexibility to use the Custom Canvas to merge data fields and create highly customized reports tailored to your unique operational needs.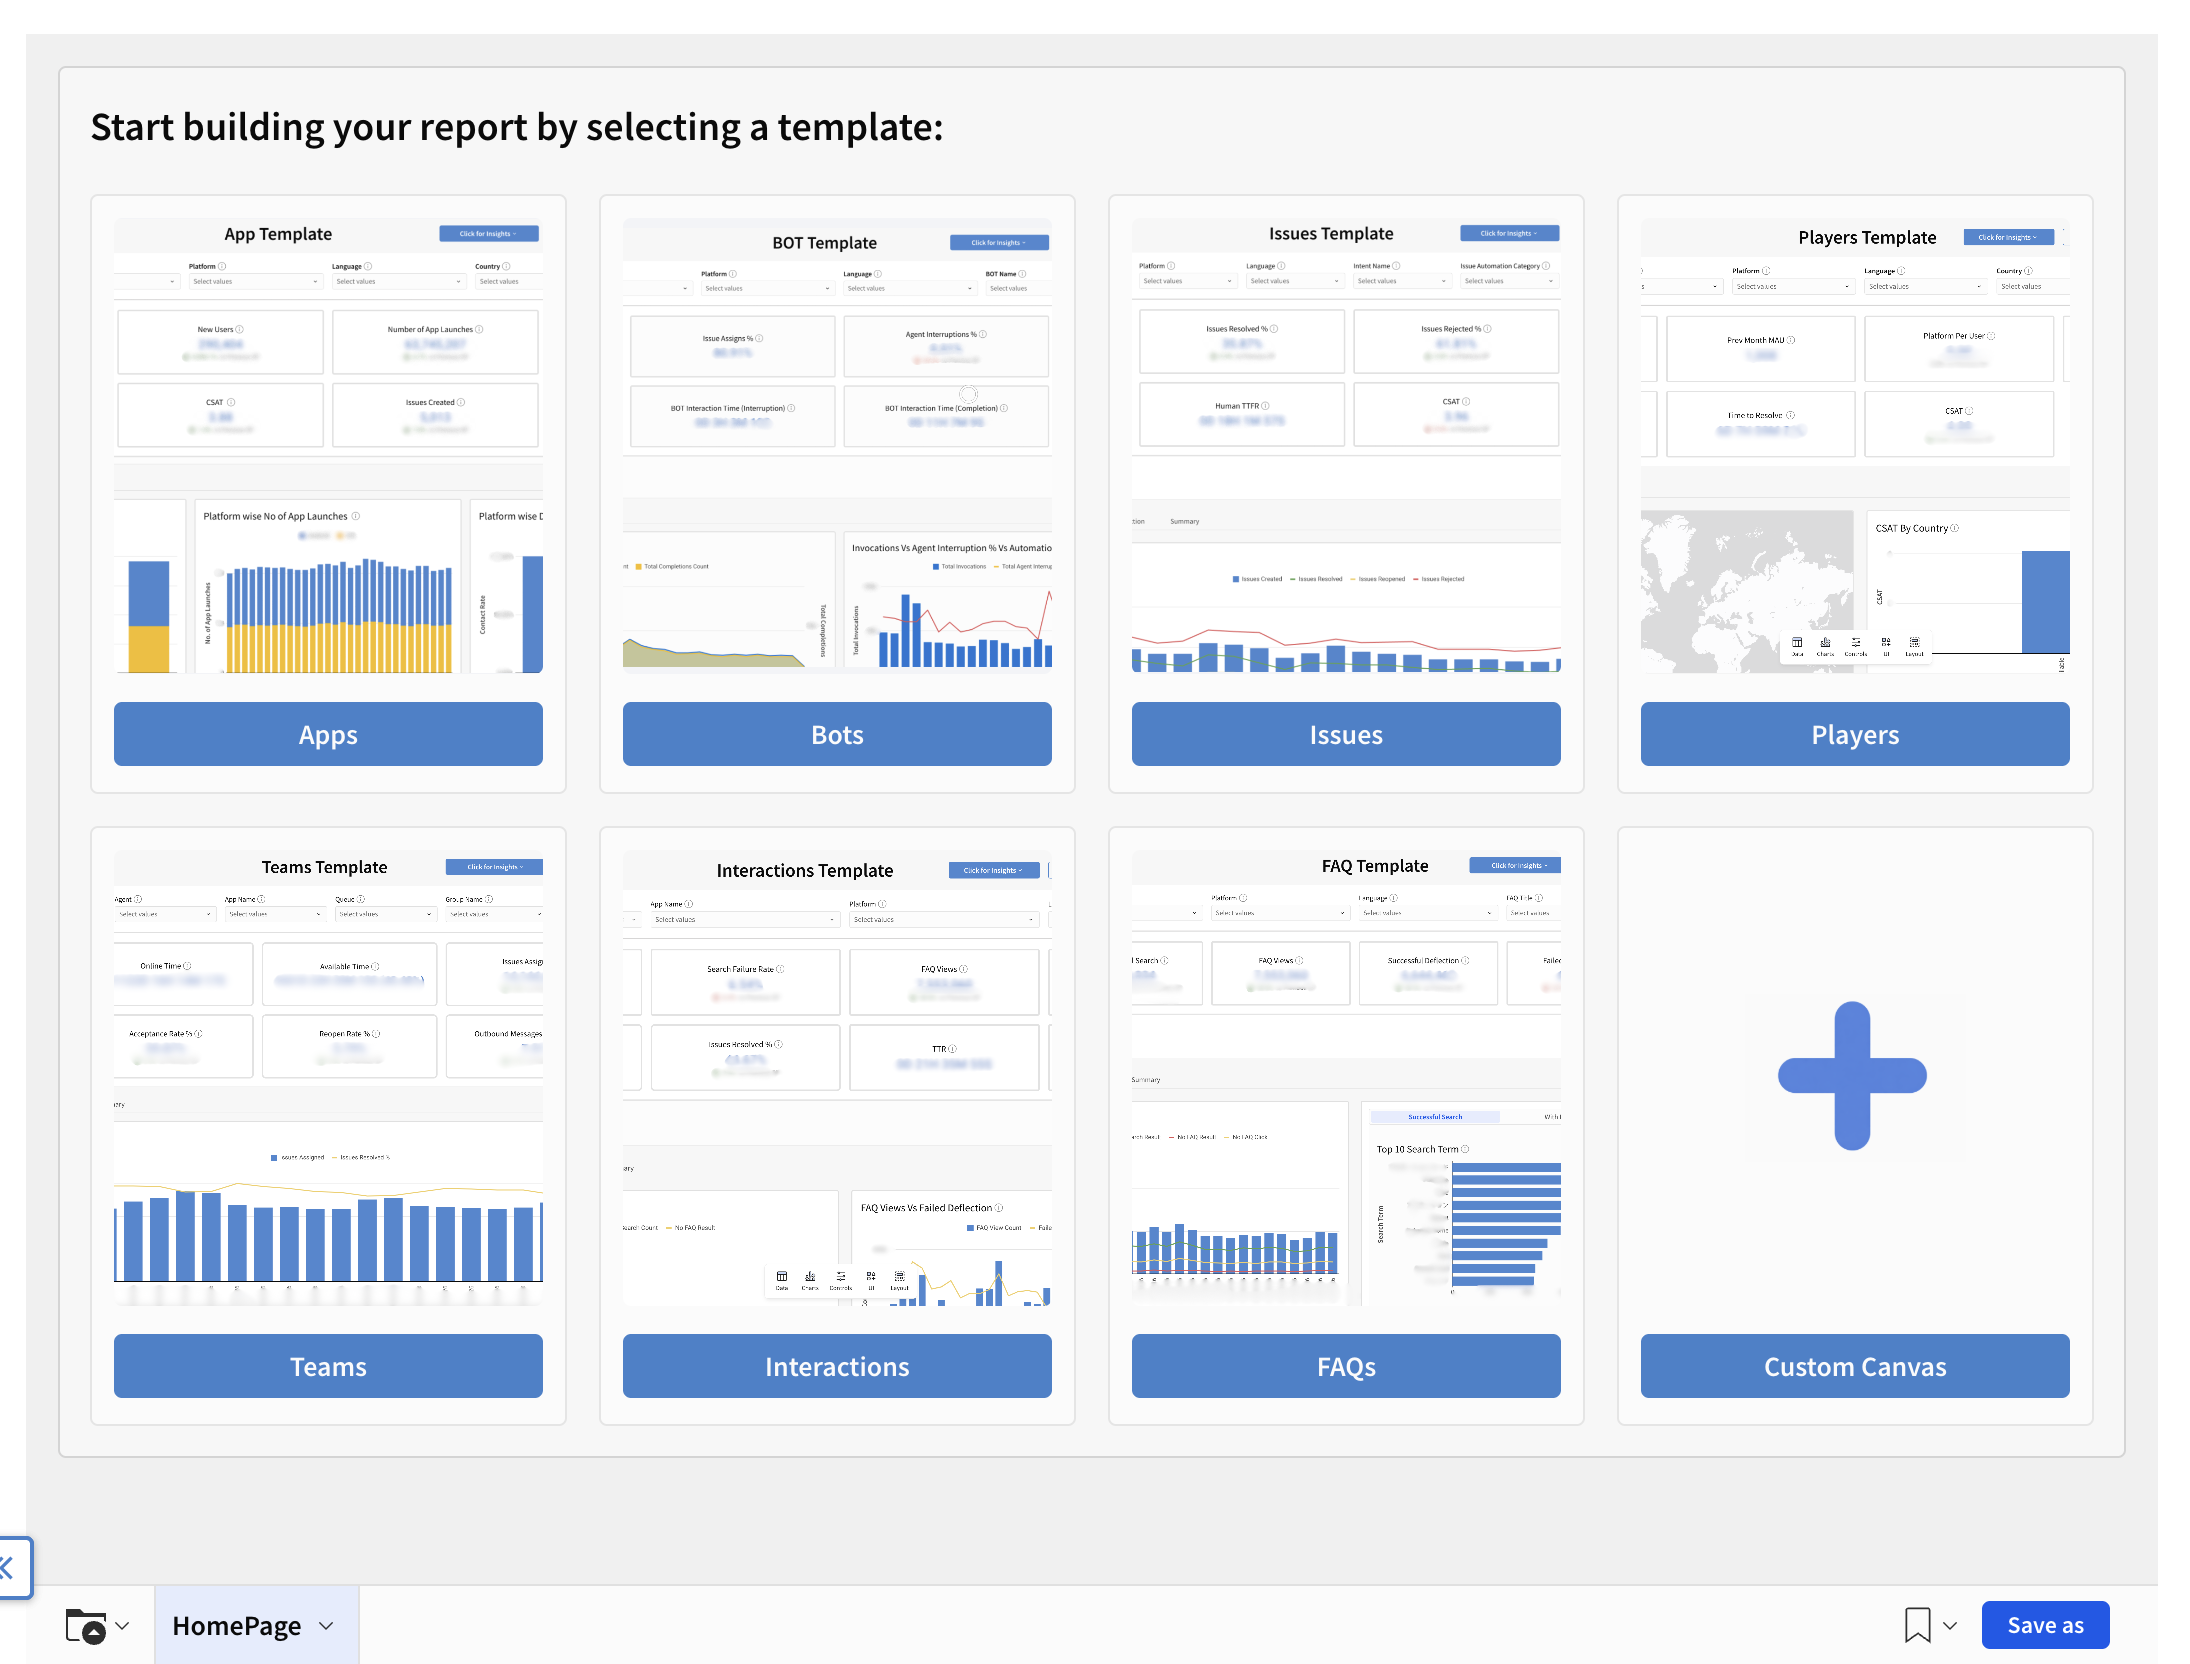
- Once done, click Save as in the bottom-right corner.
Save a copy pop-up appears to save the template as a copy.
Rename the template (e.g., "My Custom Dashboard"). - Click Save.
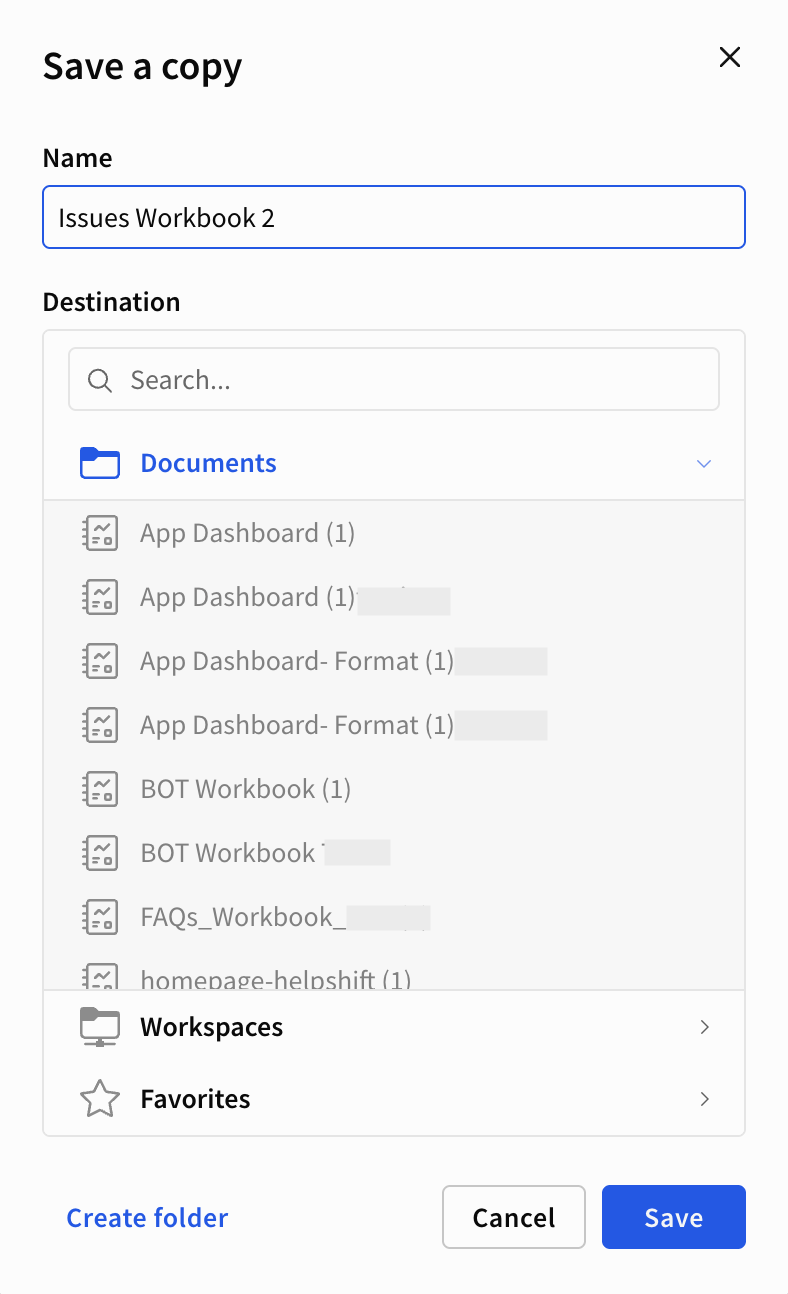
- You can save to the available Workspace to share with all Custom Analytics users, or save to Documents to keep it private.
Note: Version control in templates automatically applies any future changes to the original template to your saved copies. You can edit the template and add or remove visualizations and insights based on your preferences.
Adding Data Source
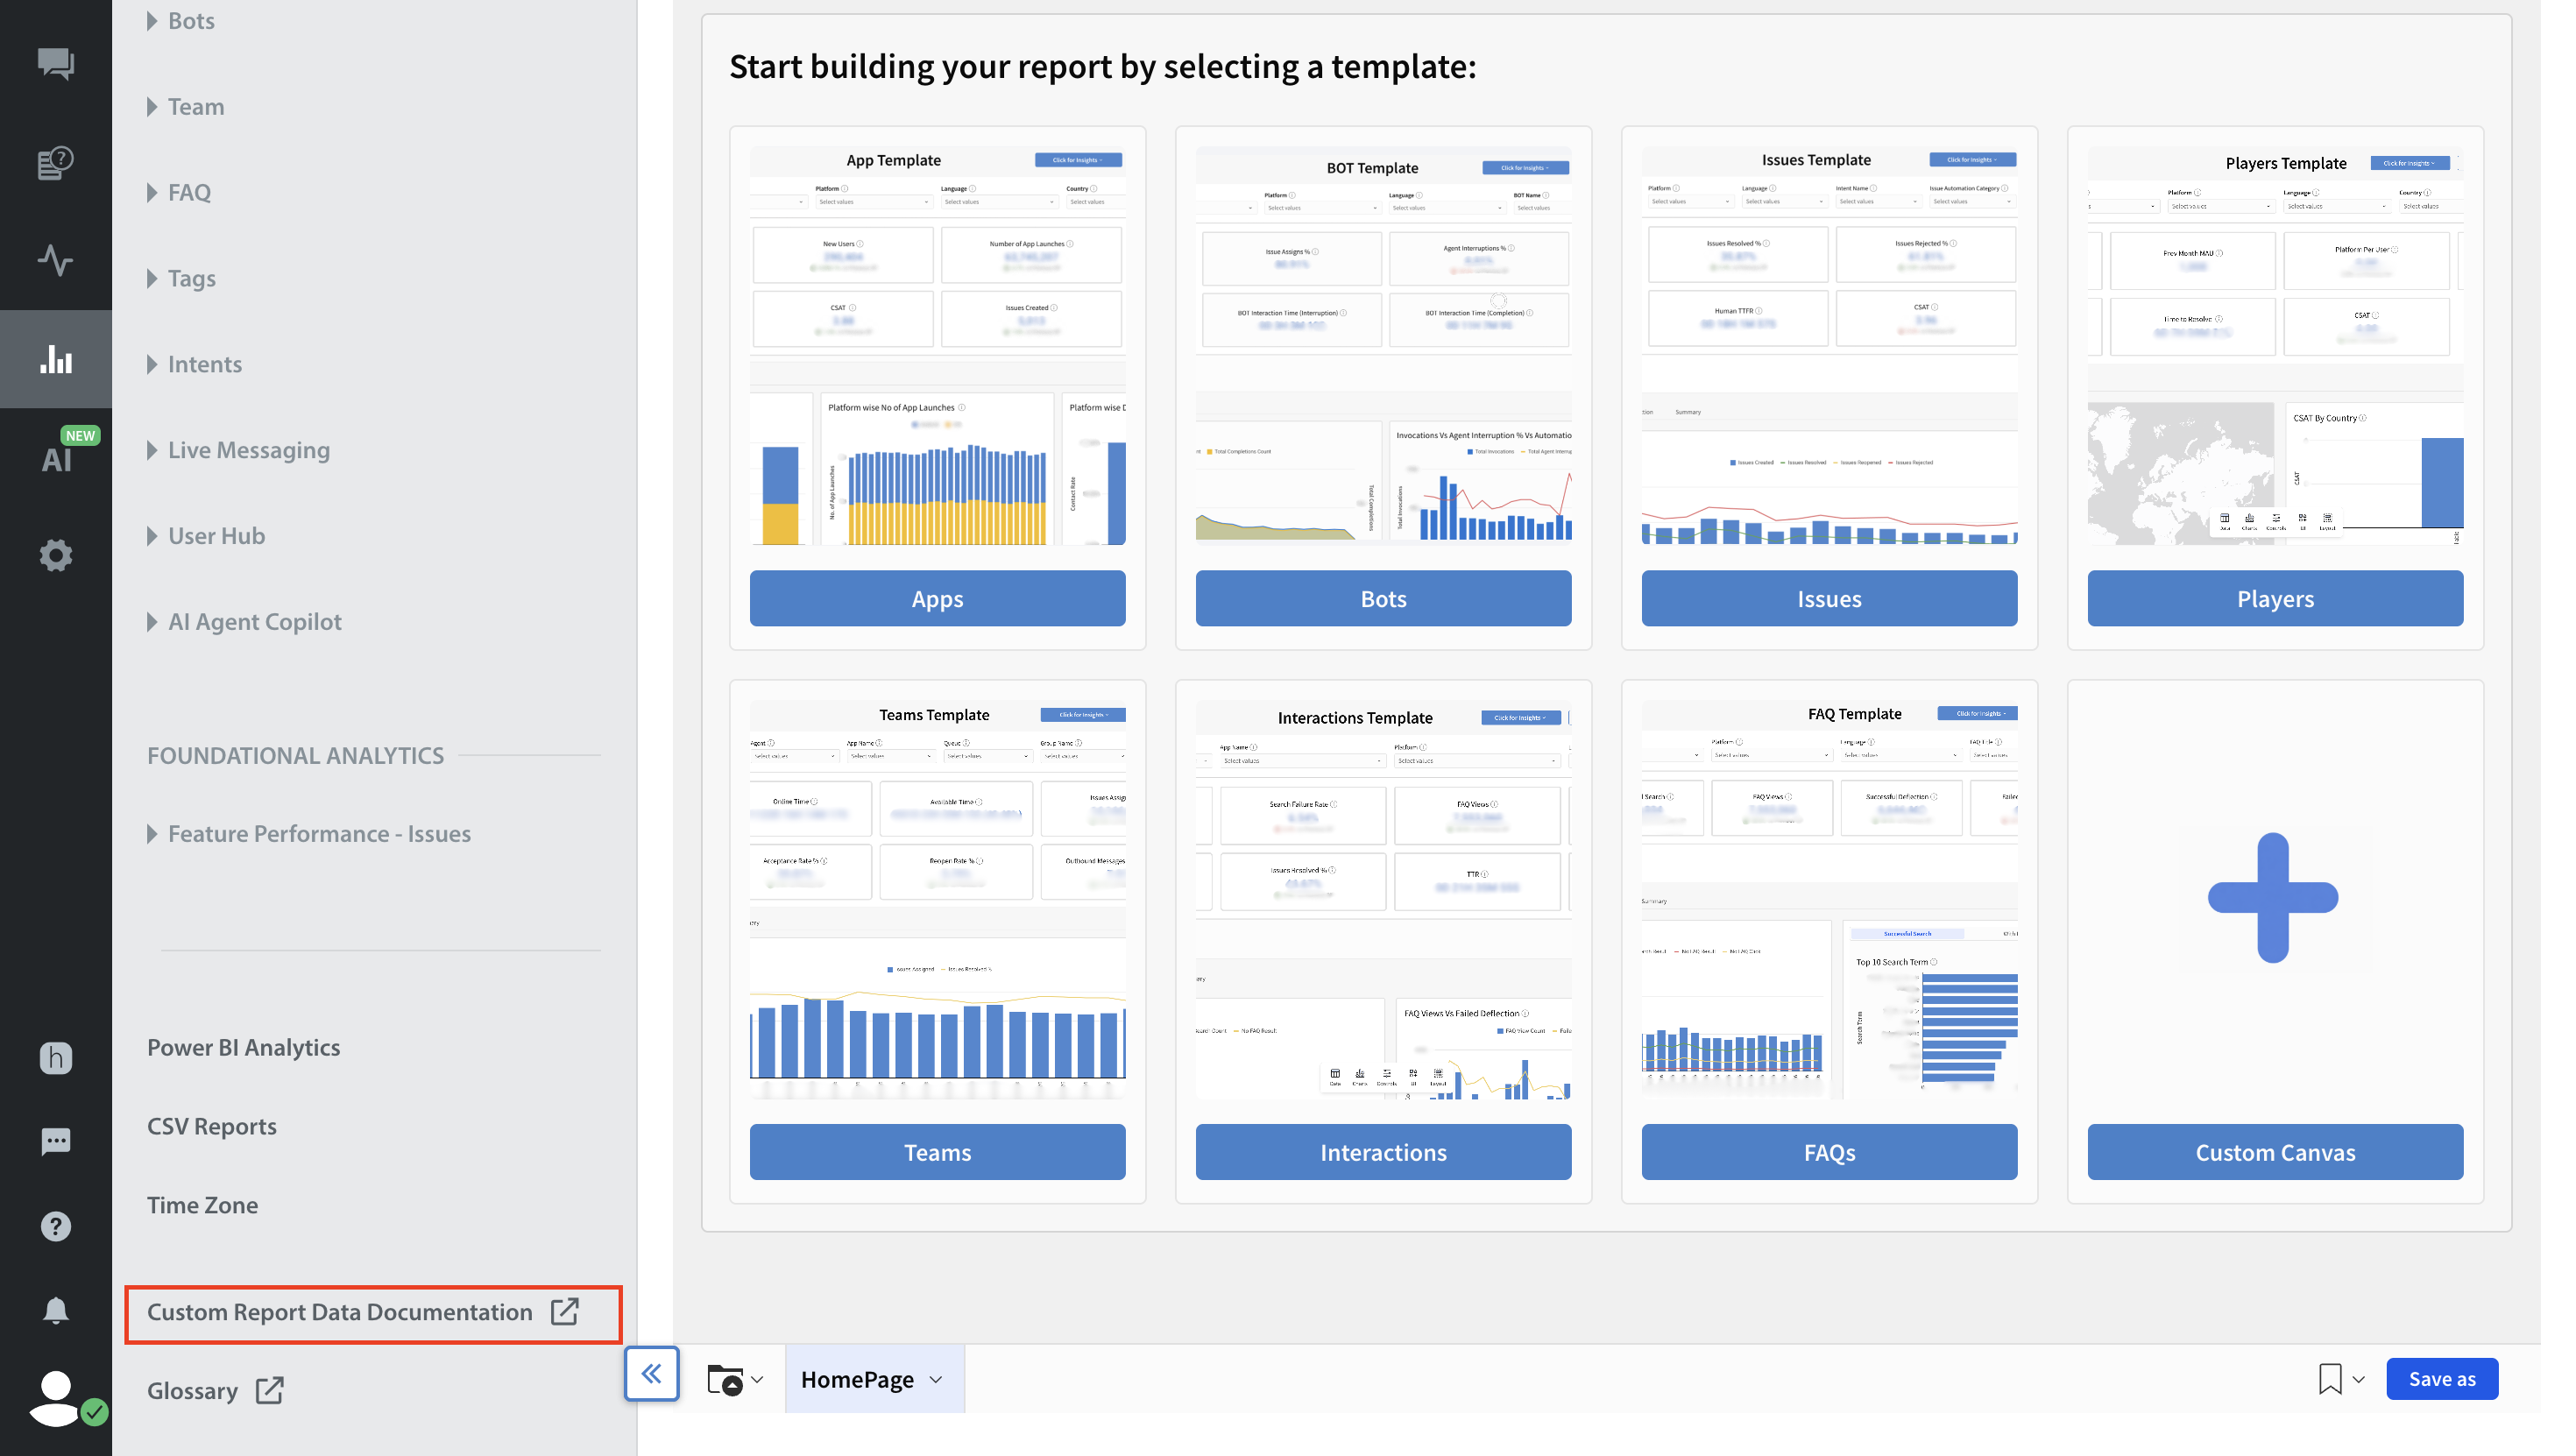
Note: To access definitions for all available metrics and fields you can use in your reports, click the Custom Report Data Documentation link at the bottom of the Analytics left navigation sidebar.
To add the data points you want to visualize in the chart, follow these steps:
- In the newly saved template, click Charts in the bottom center.
Choose your chart based on the data points you want to visualize.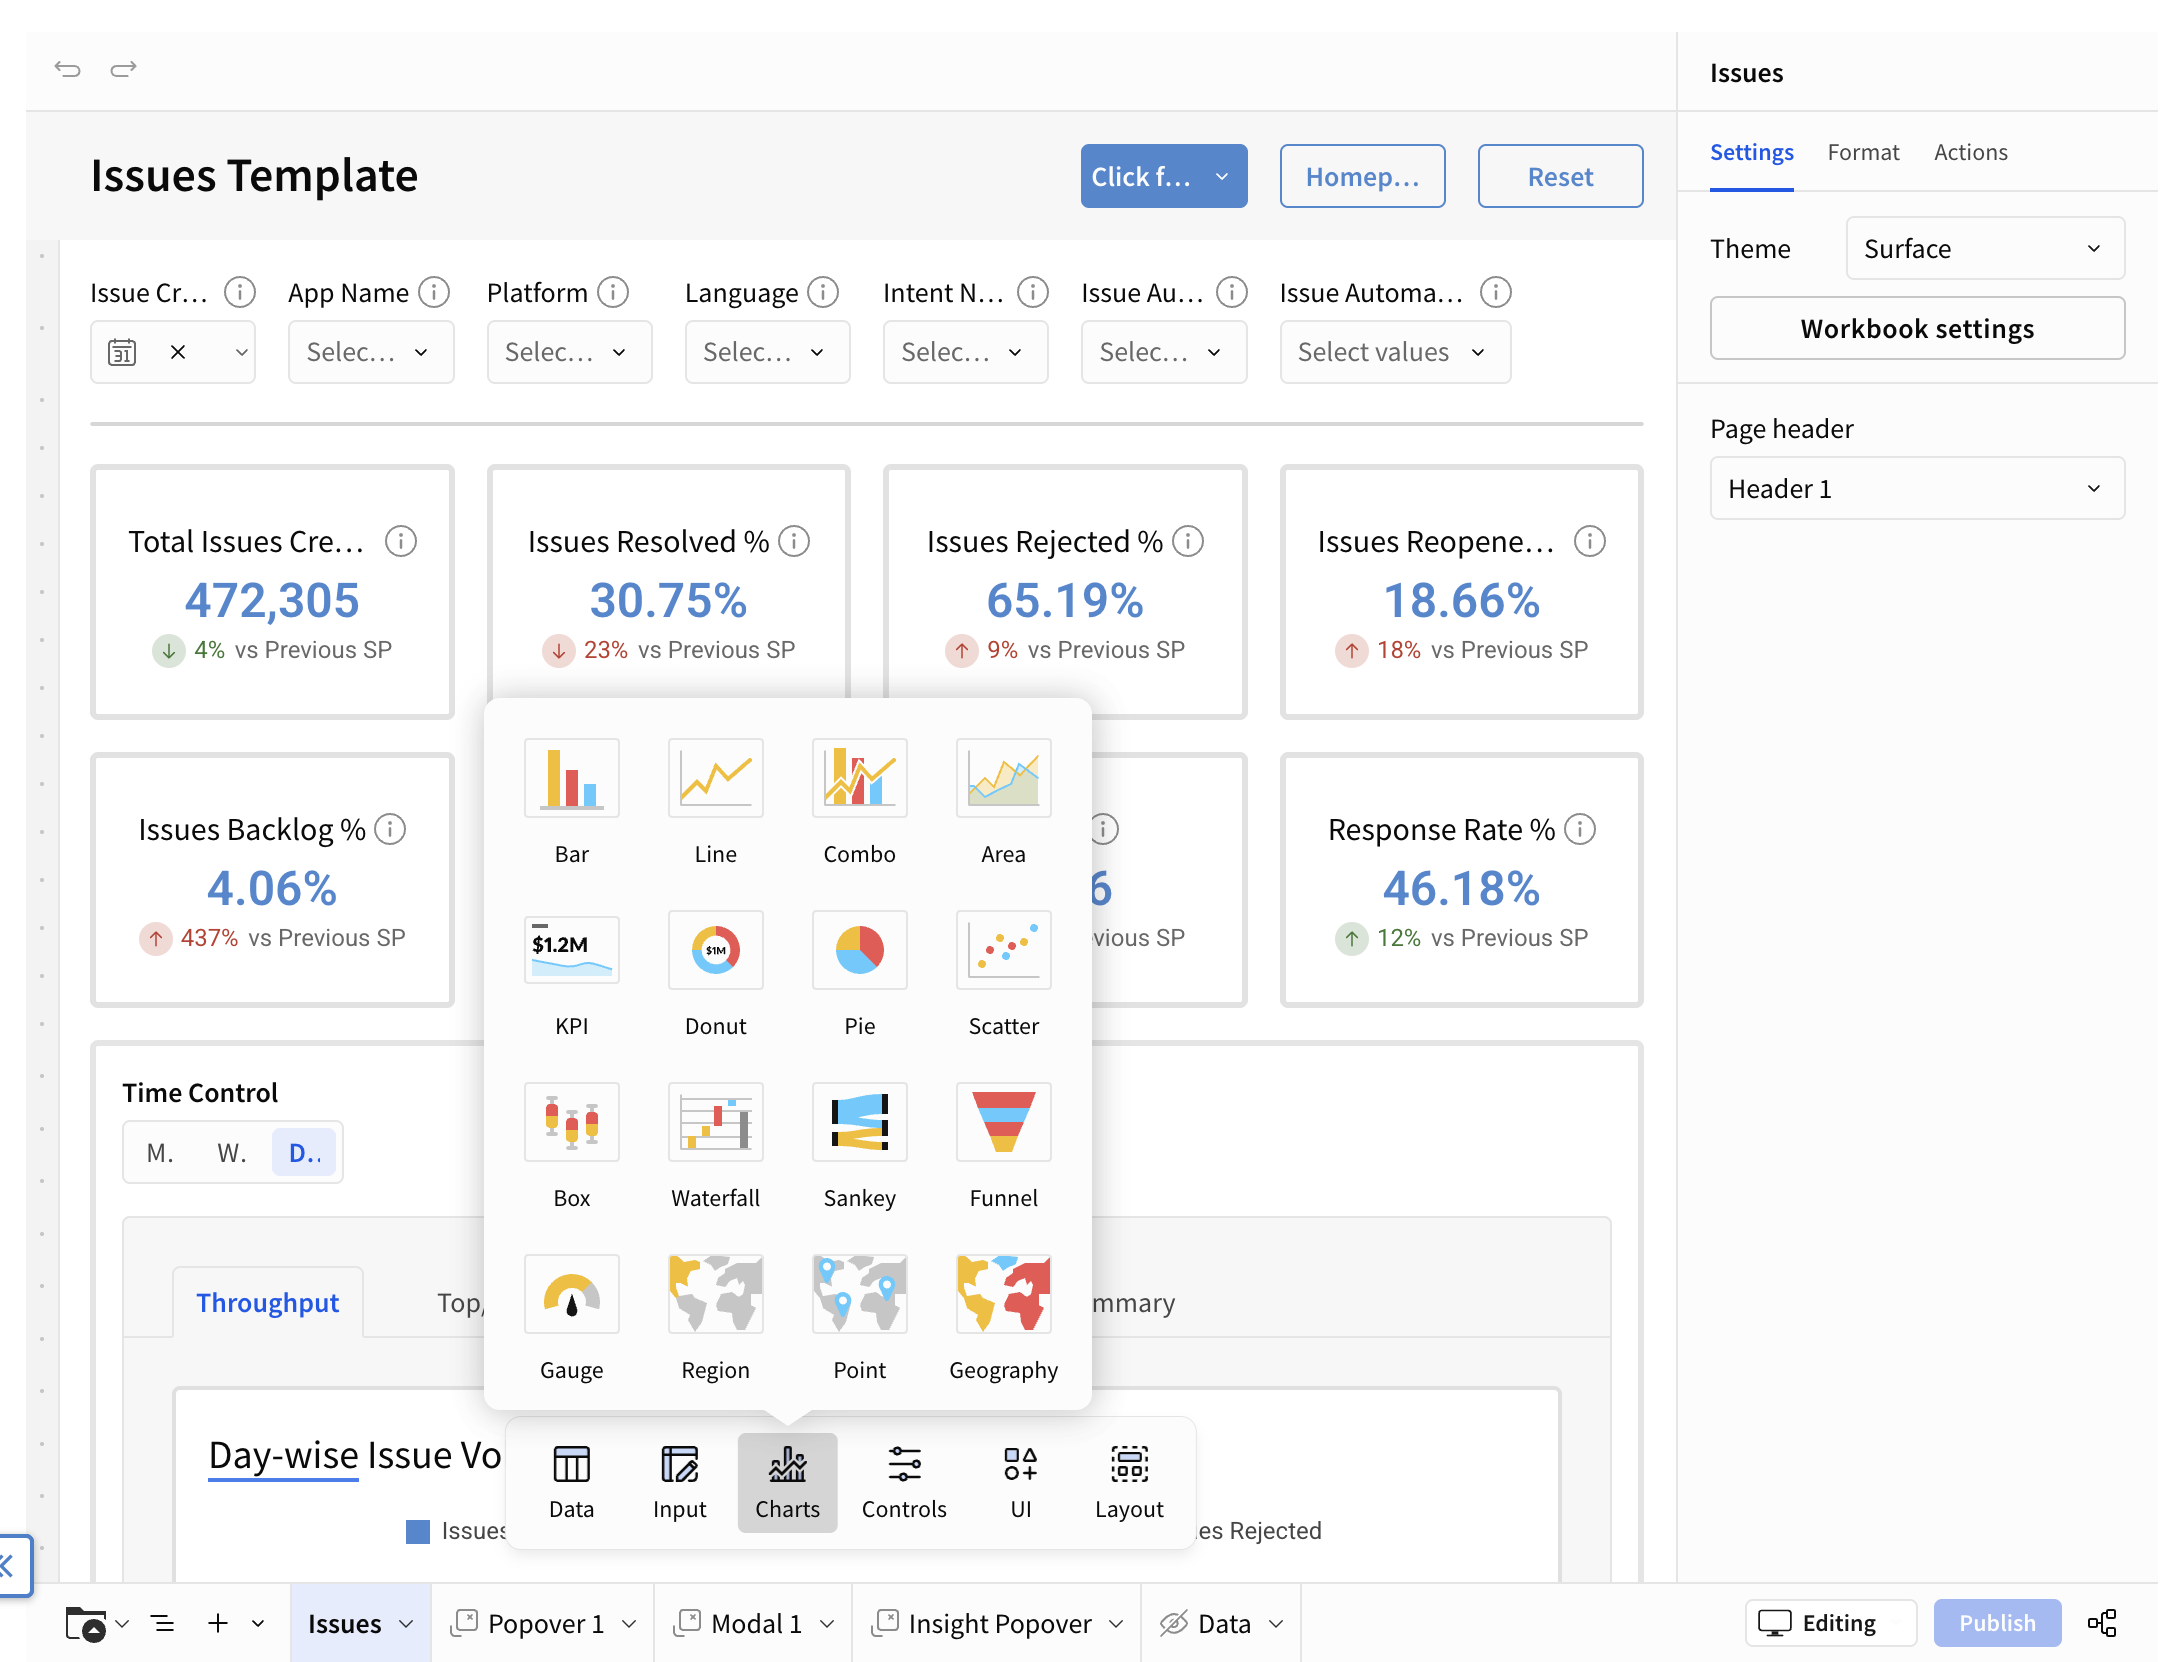
- In the Select Source panel, click the Data Sources tab.
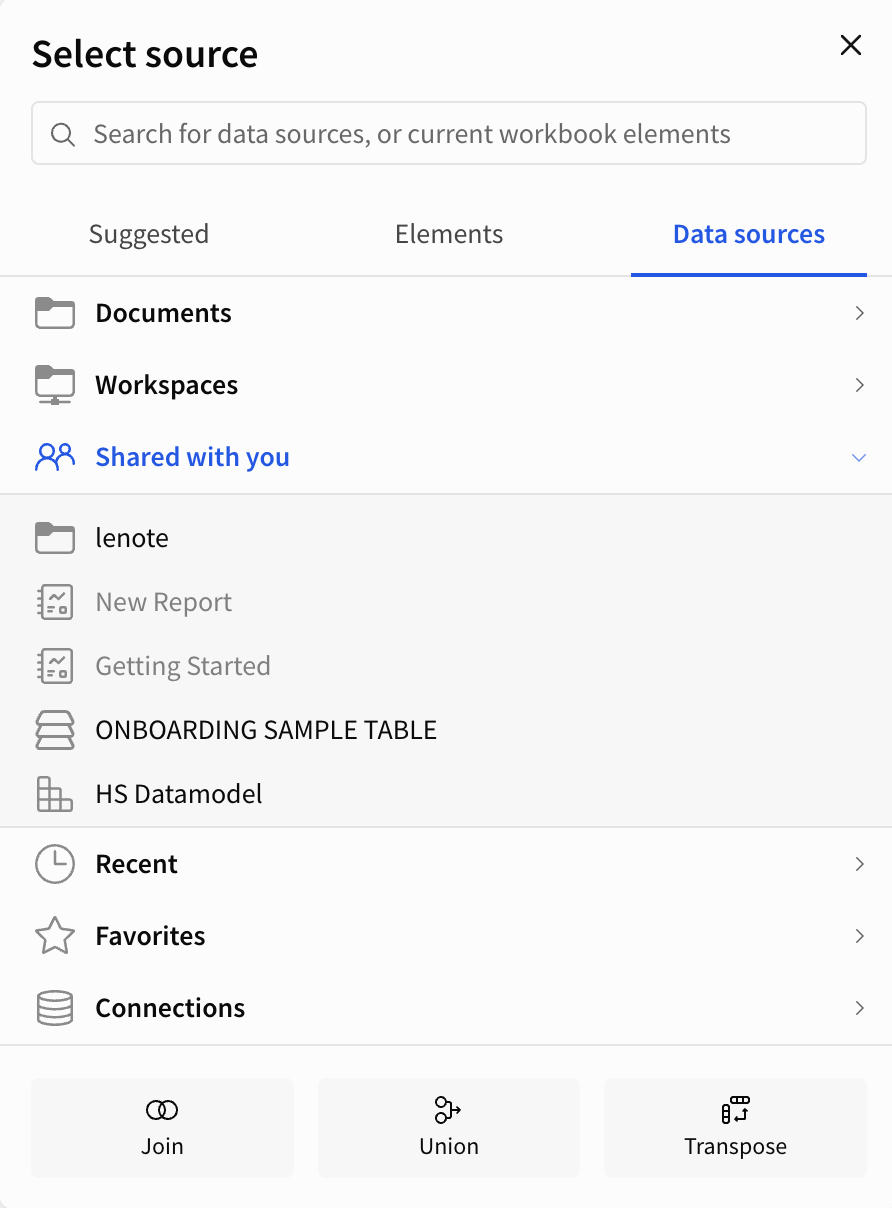
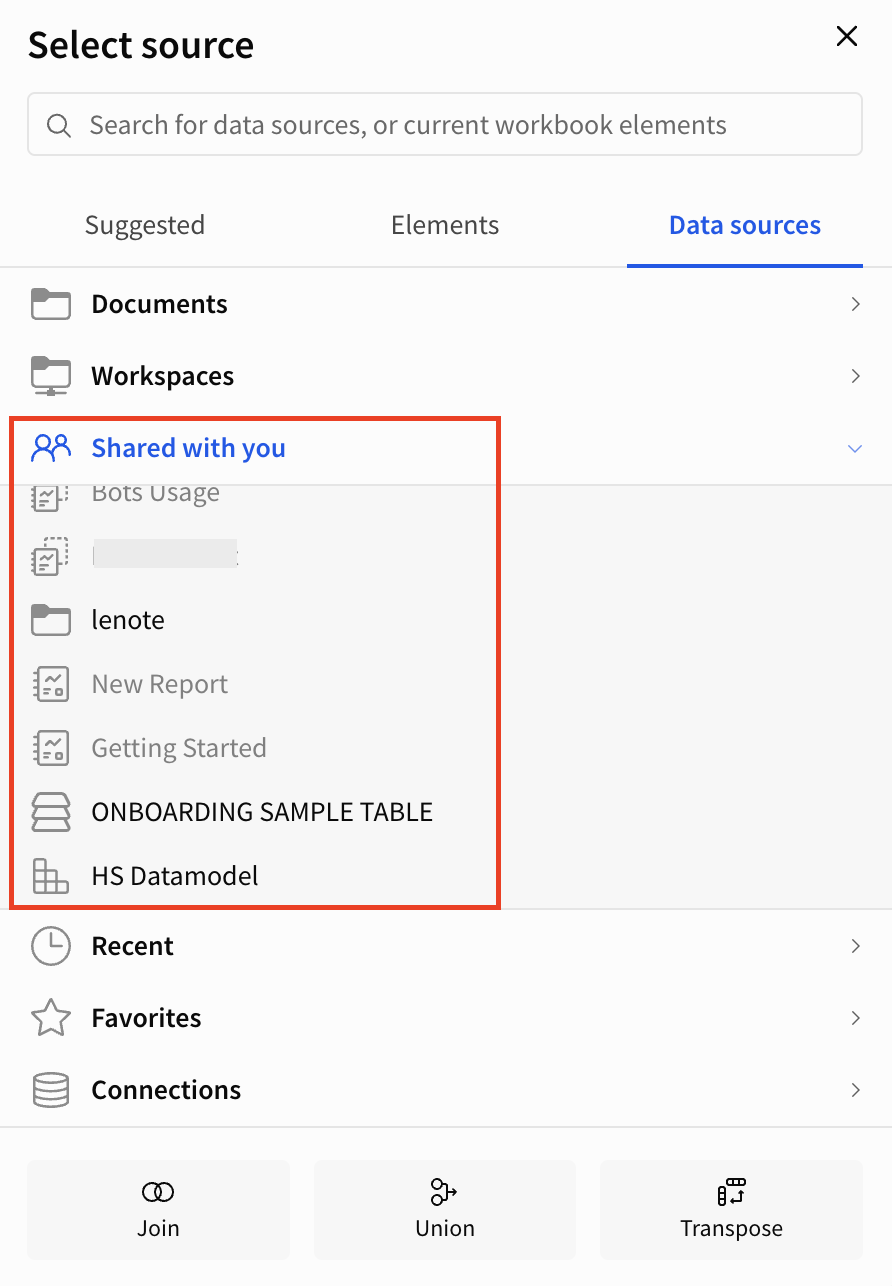
- Select the Shared with you tab provided in the original report.
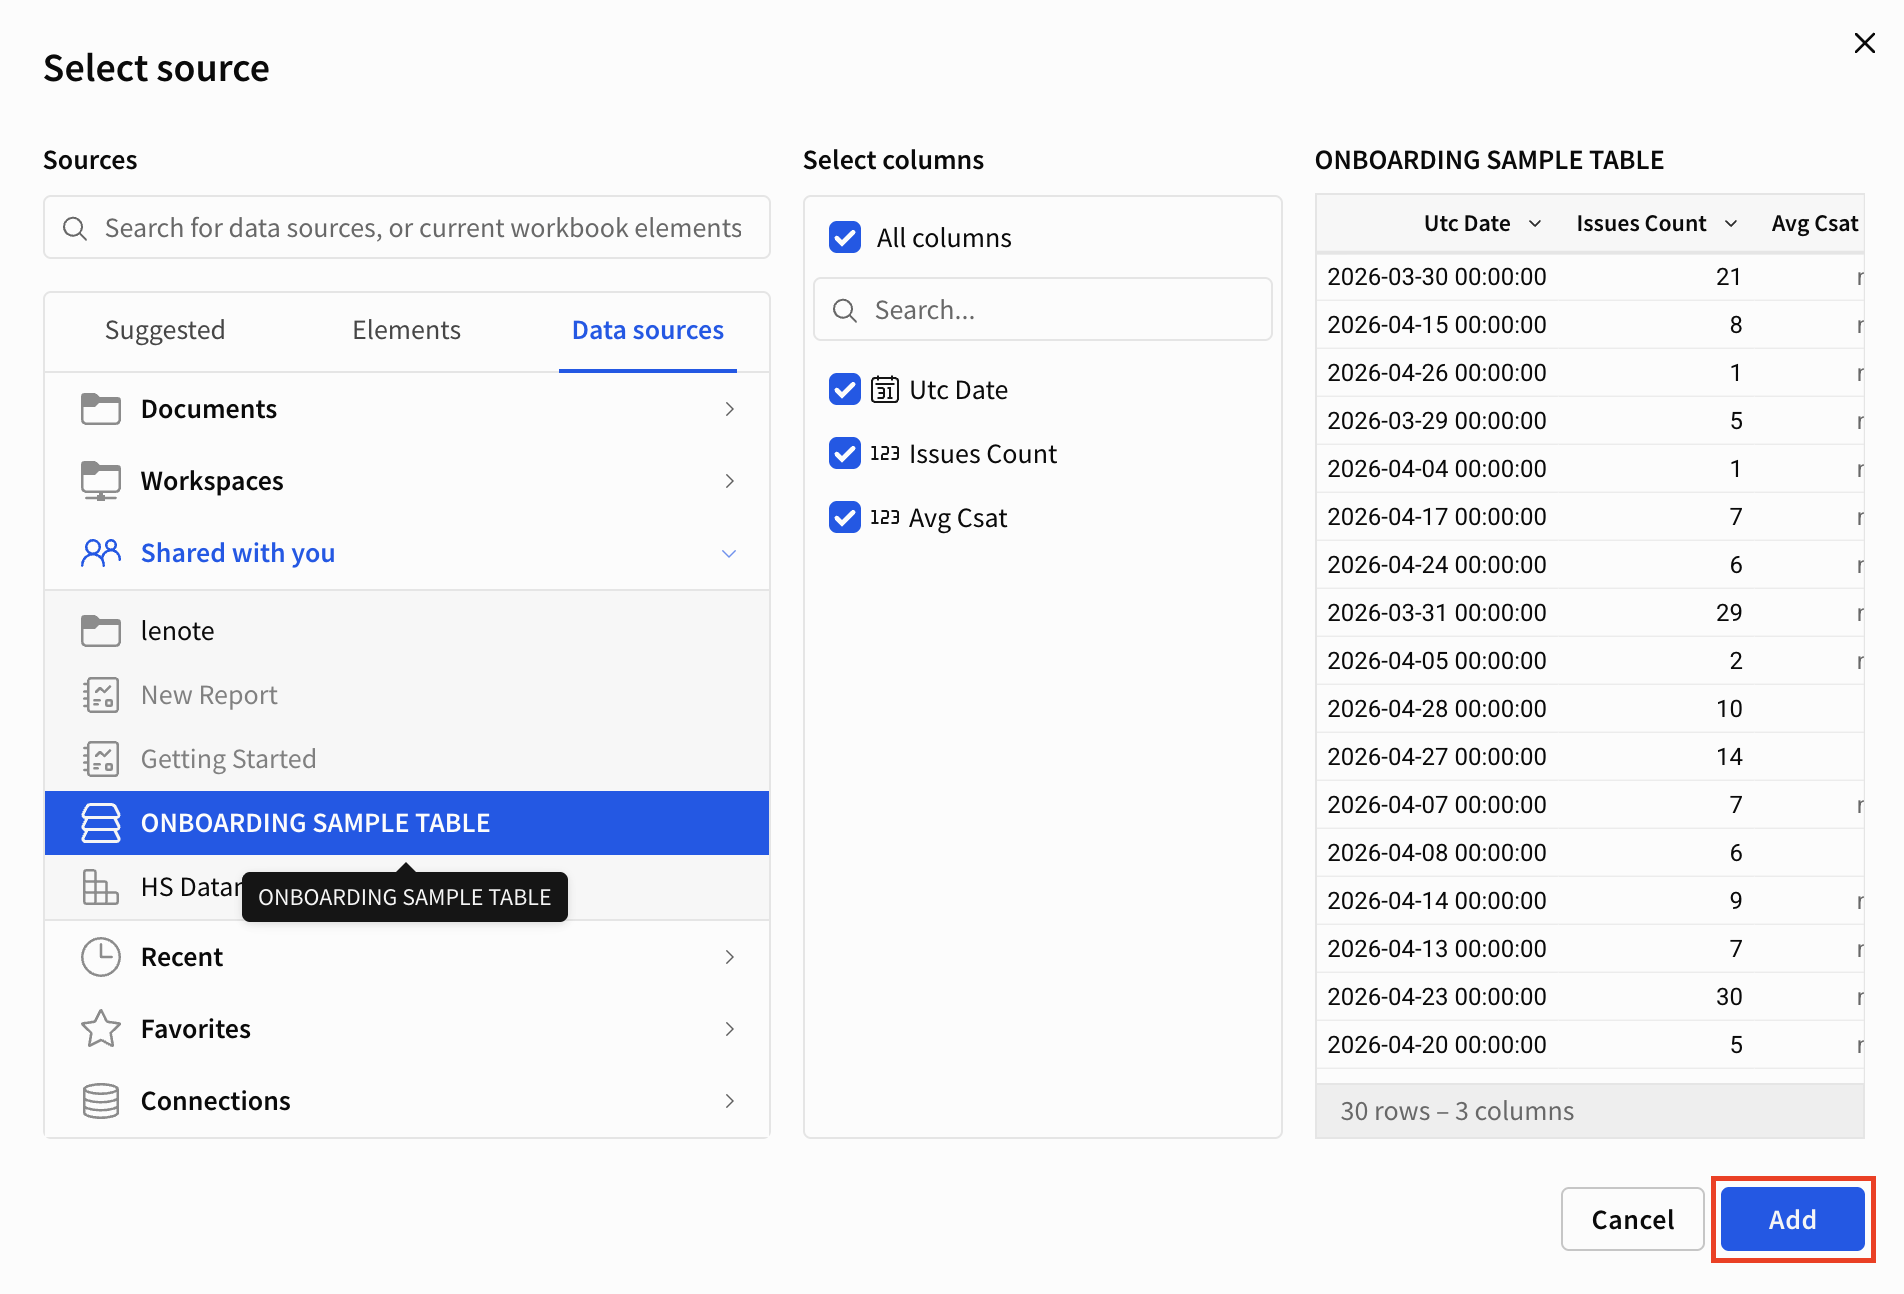
- Click Preview to view the Data you want.
- Preview the dataset, select the columns you need, and click Add.
Note: All data in Custom Analytics is displayed and refreshed in UTC time.
Adding Data to a Chart
Note: When adding a data-driven element, always select the Data Sources tab, click Shared with me, and choose the HS Datamodel to ensure accurate, standardized reporting.
To create and customize the report, follow these steps:
- Navigate to the Properties tab.
- Click on the (+) icon to add columns as data points on the X-AXIS and the Y-AXIS.
For example, to know the maximum and minimum percentages of issues resolved in each app.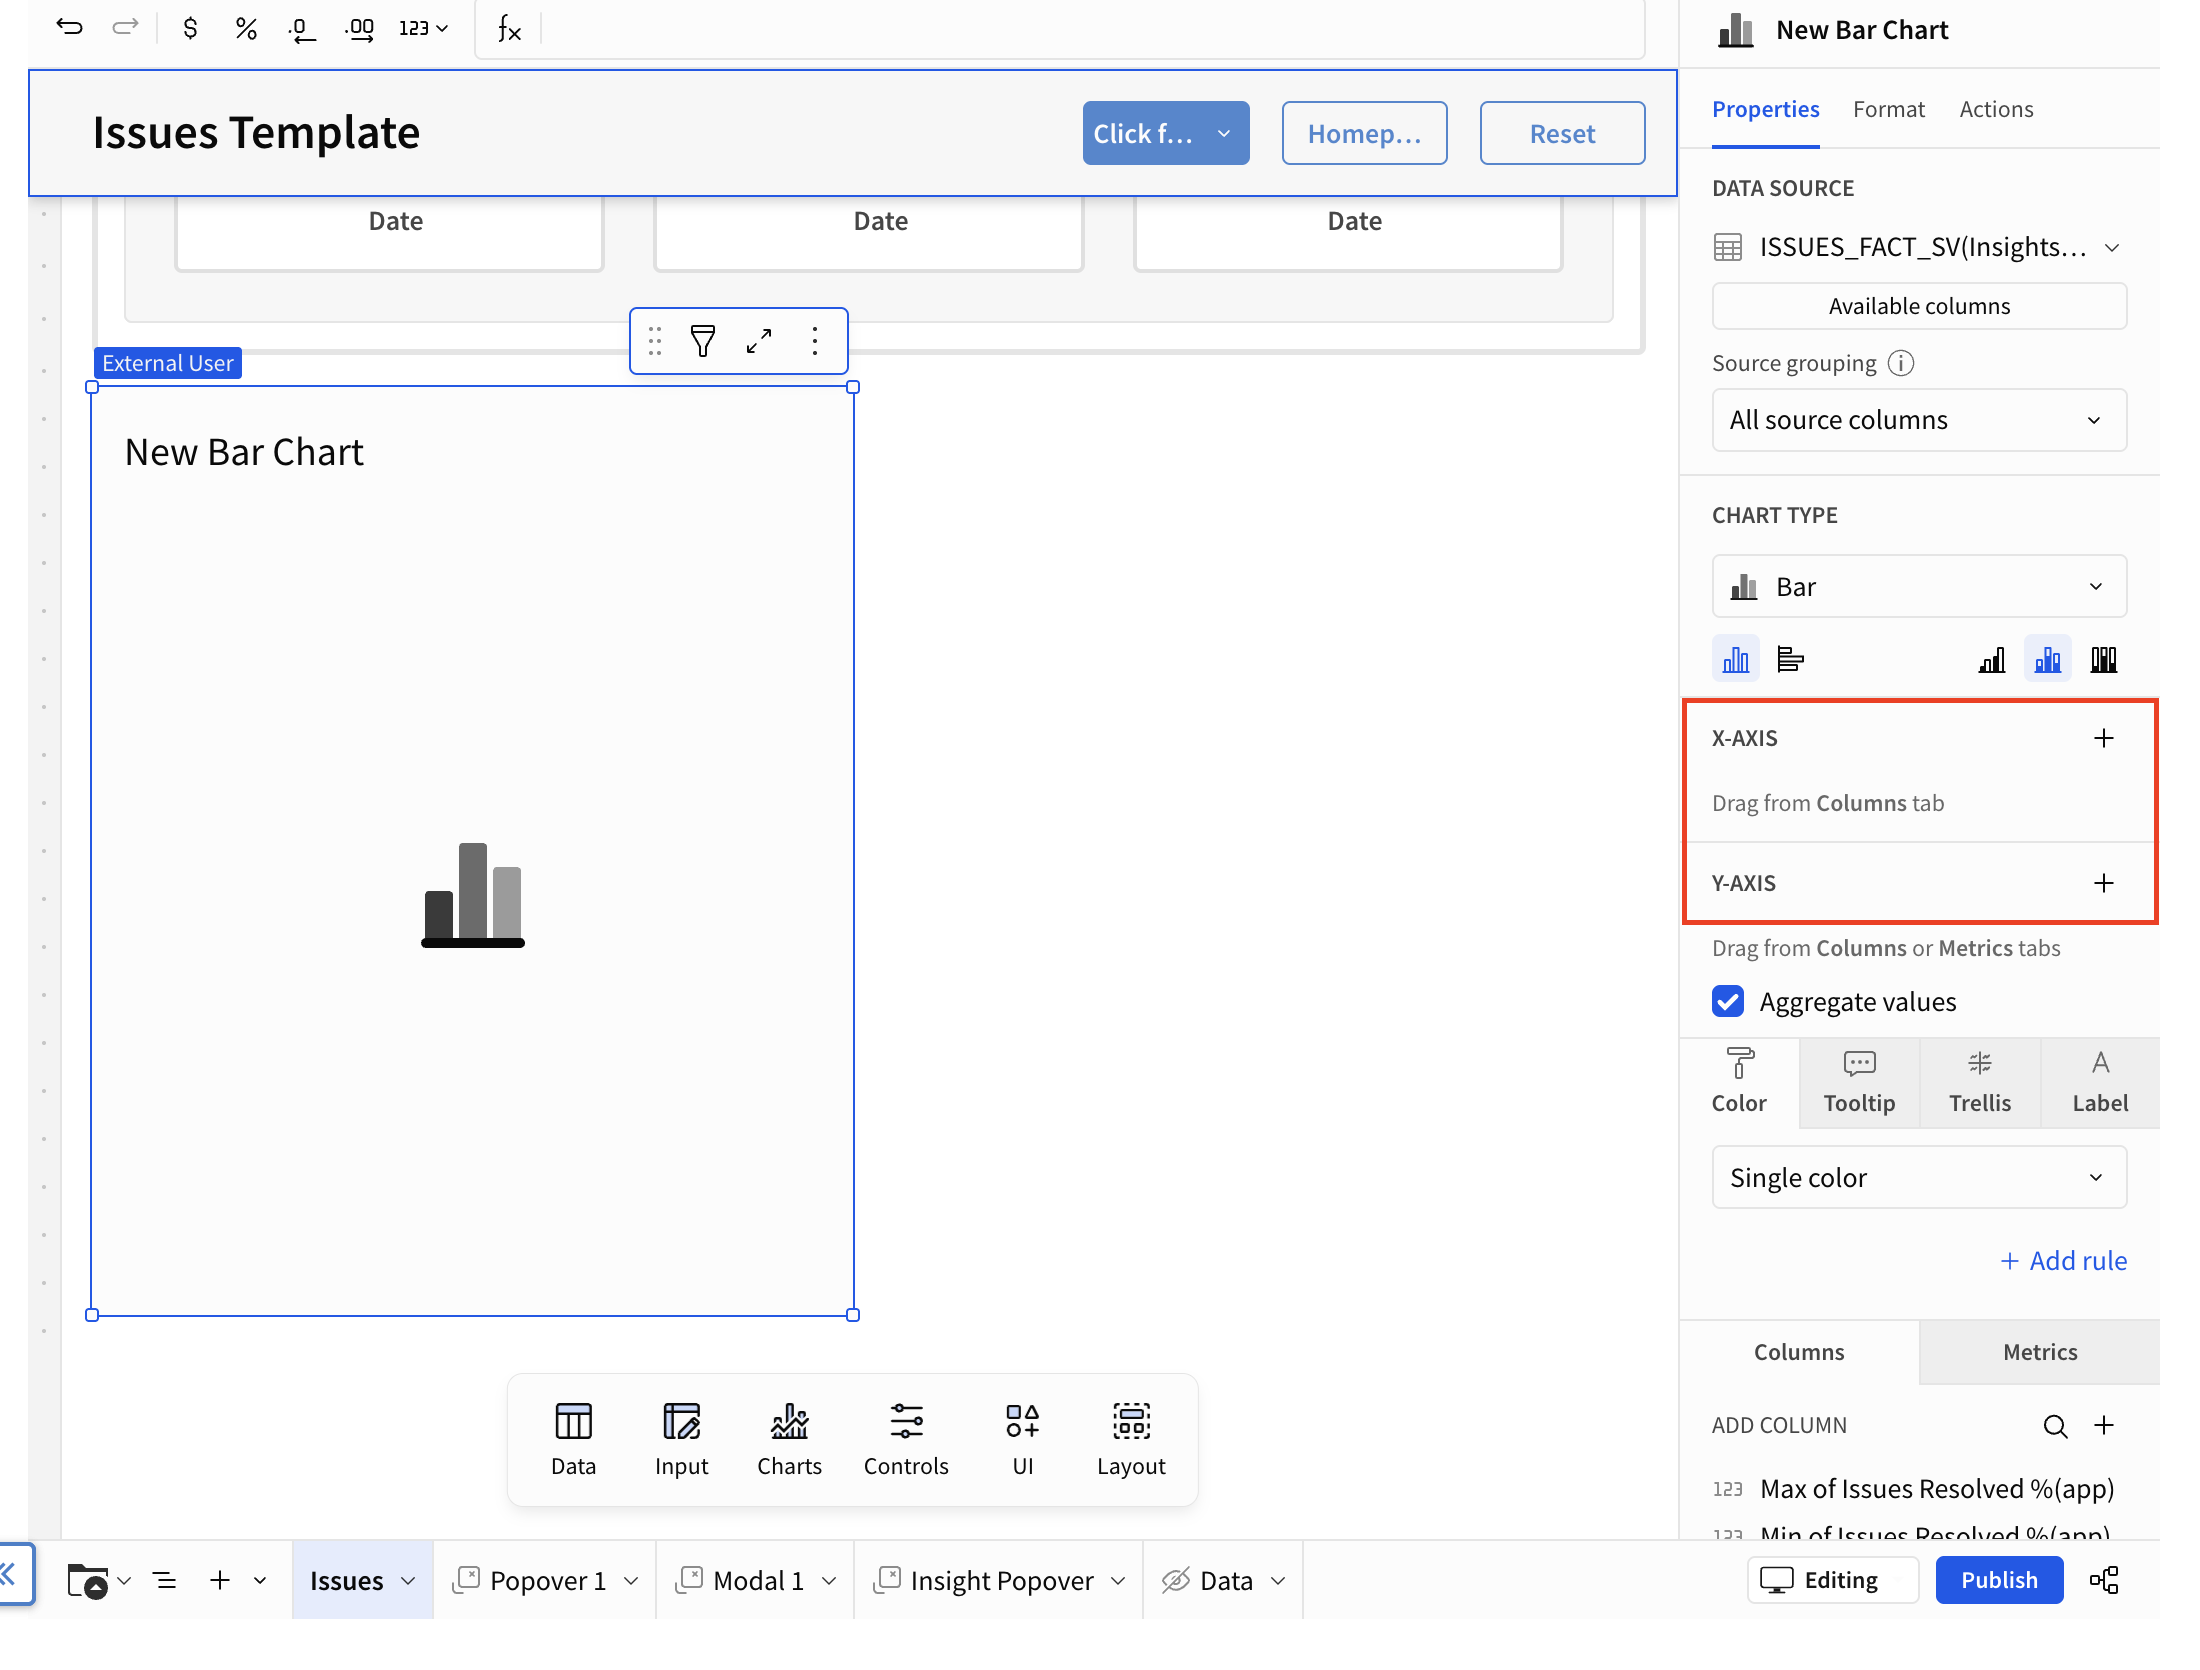
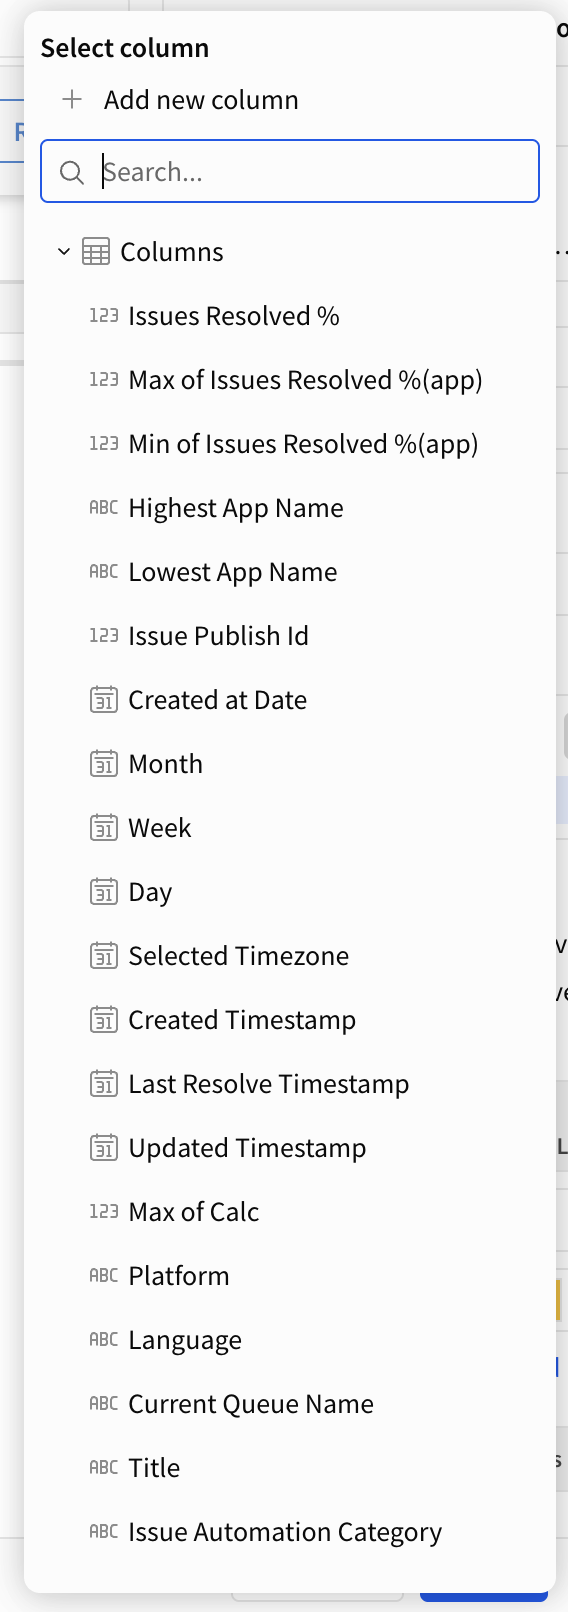
- Select the column for the X-axis (e.g., App Name).
- Select the columns for the Y-axis (e.g., Max of Issues Resolved % (app) and Min of Issues Resolved % (app).
- You can visualize the bar chart based on the data sources you selected.
Hover over the bar and view the result.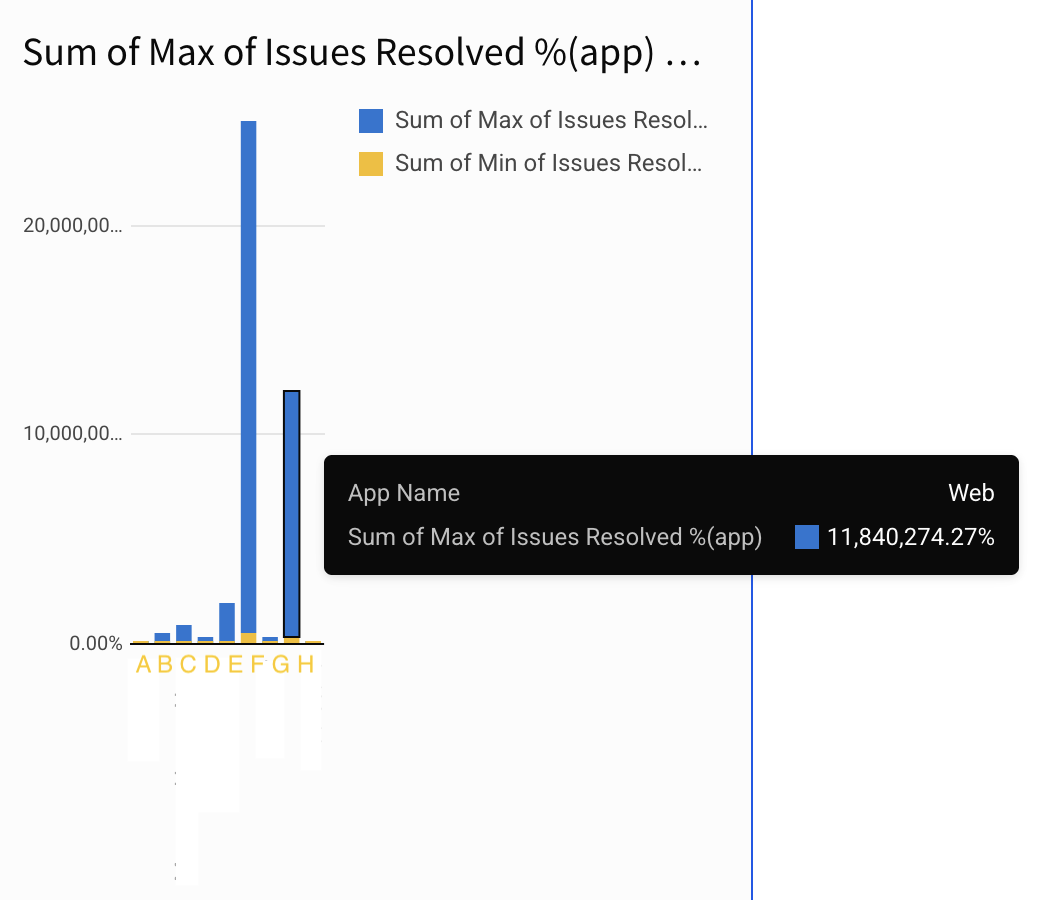
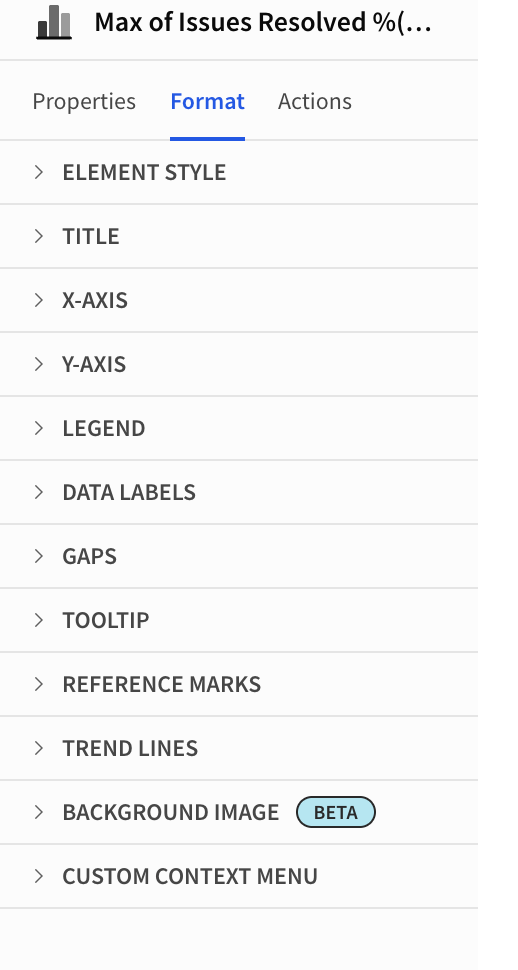
Formatting chart
Once the chart is created, navigate to the Formats tab to style it as needed.
Connecting Charts to filters
To connect the chart to filters, follow these steps:
- Scroll to the top of your template and click the date range or calendar.
This will open the Control Properties panel on the right side of your screen.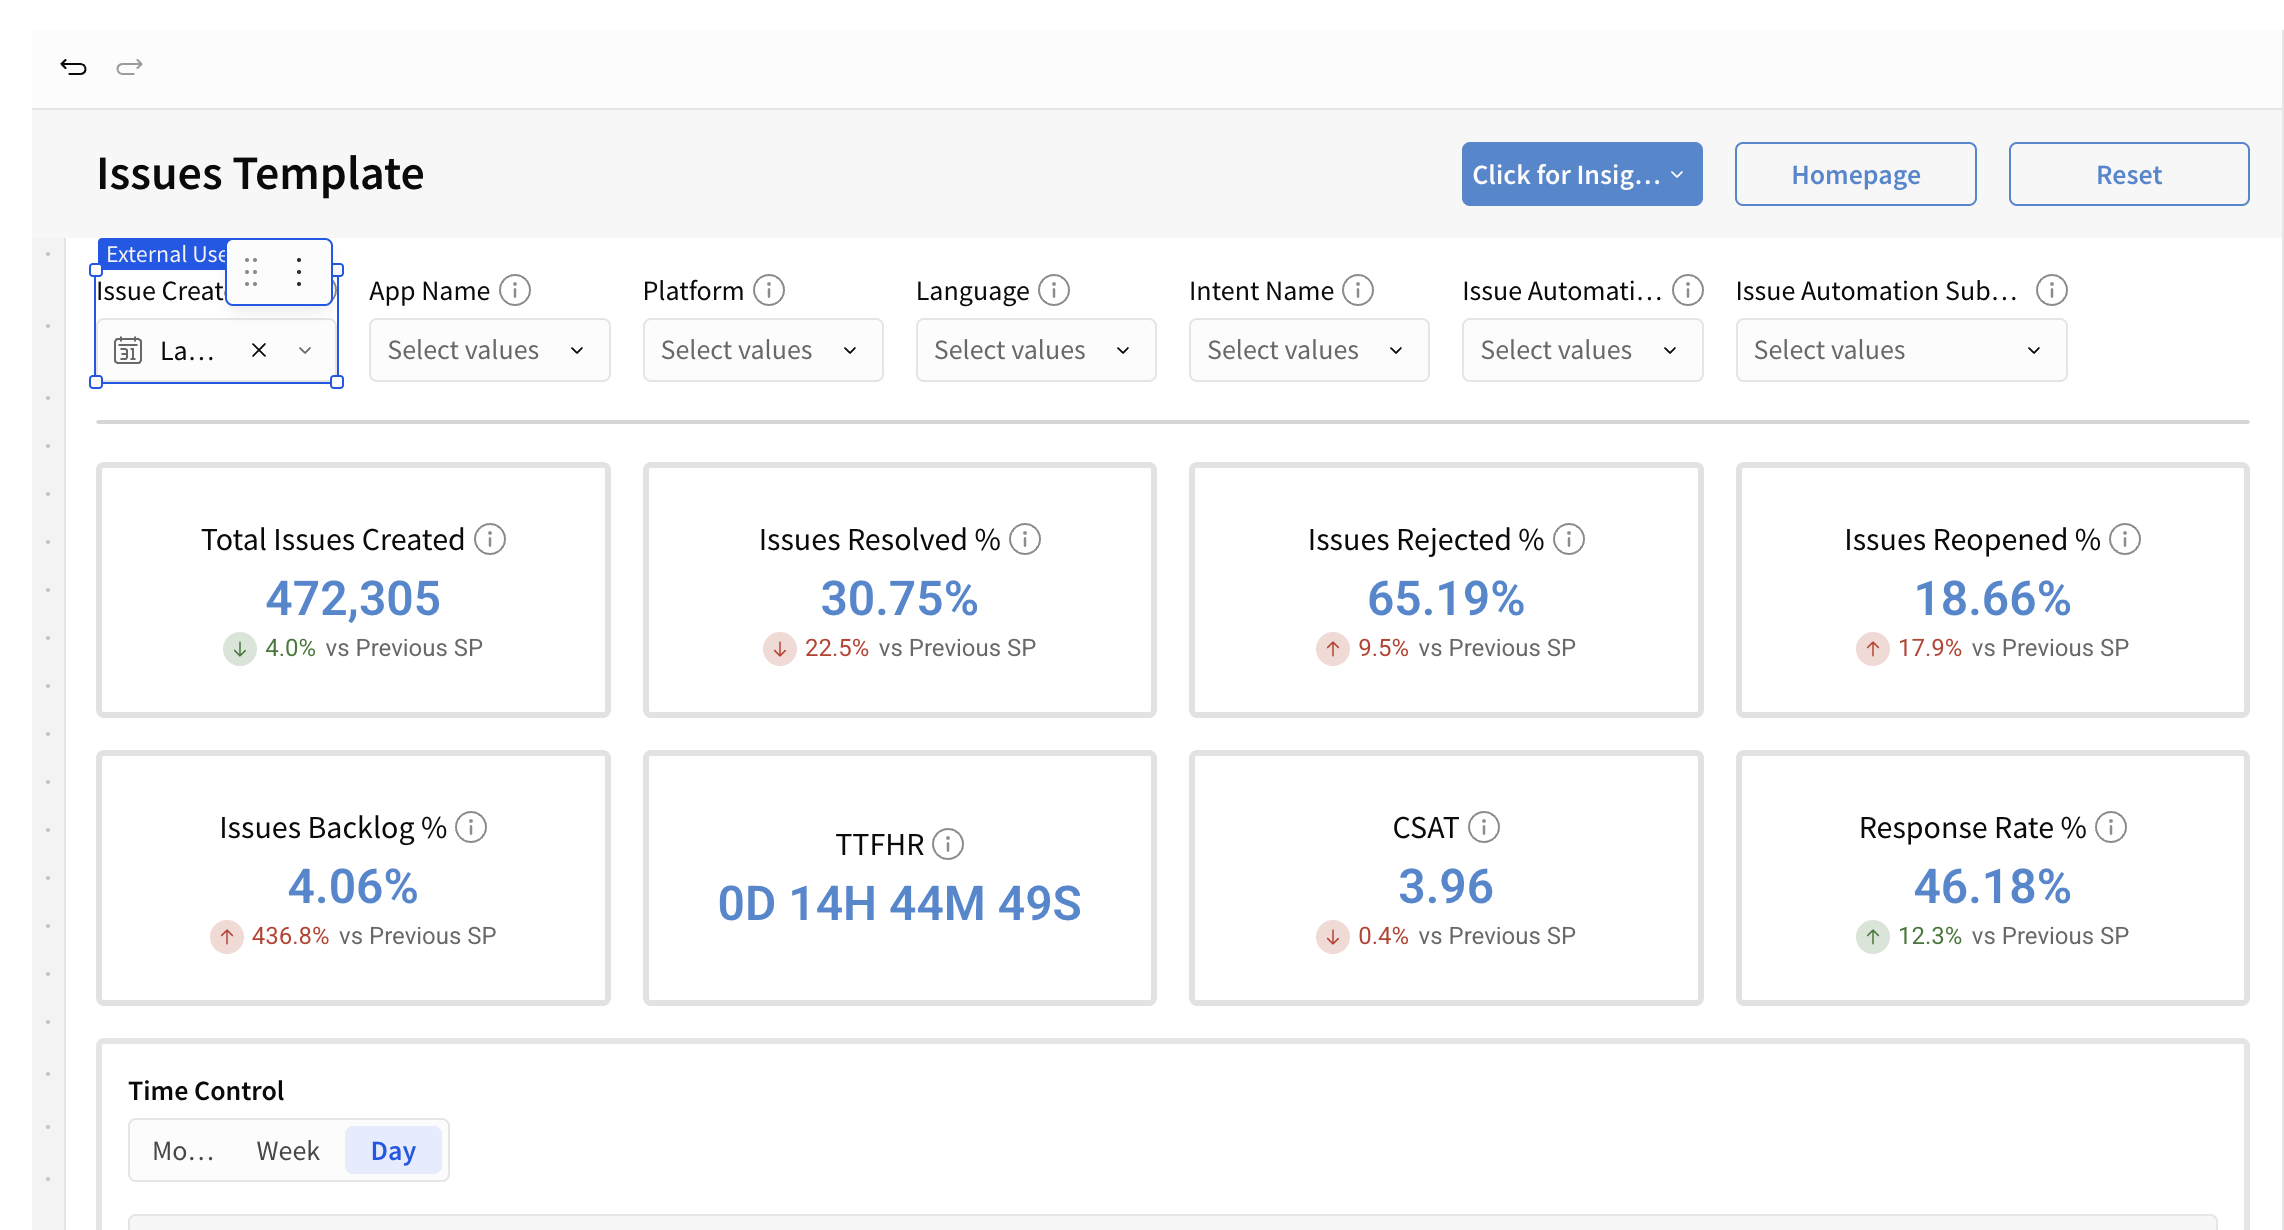
- In the properties panel, click the Targets tab.
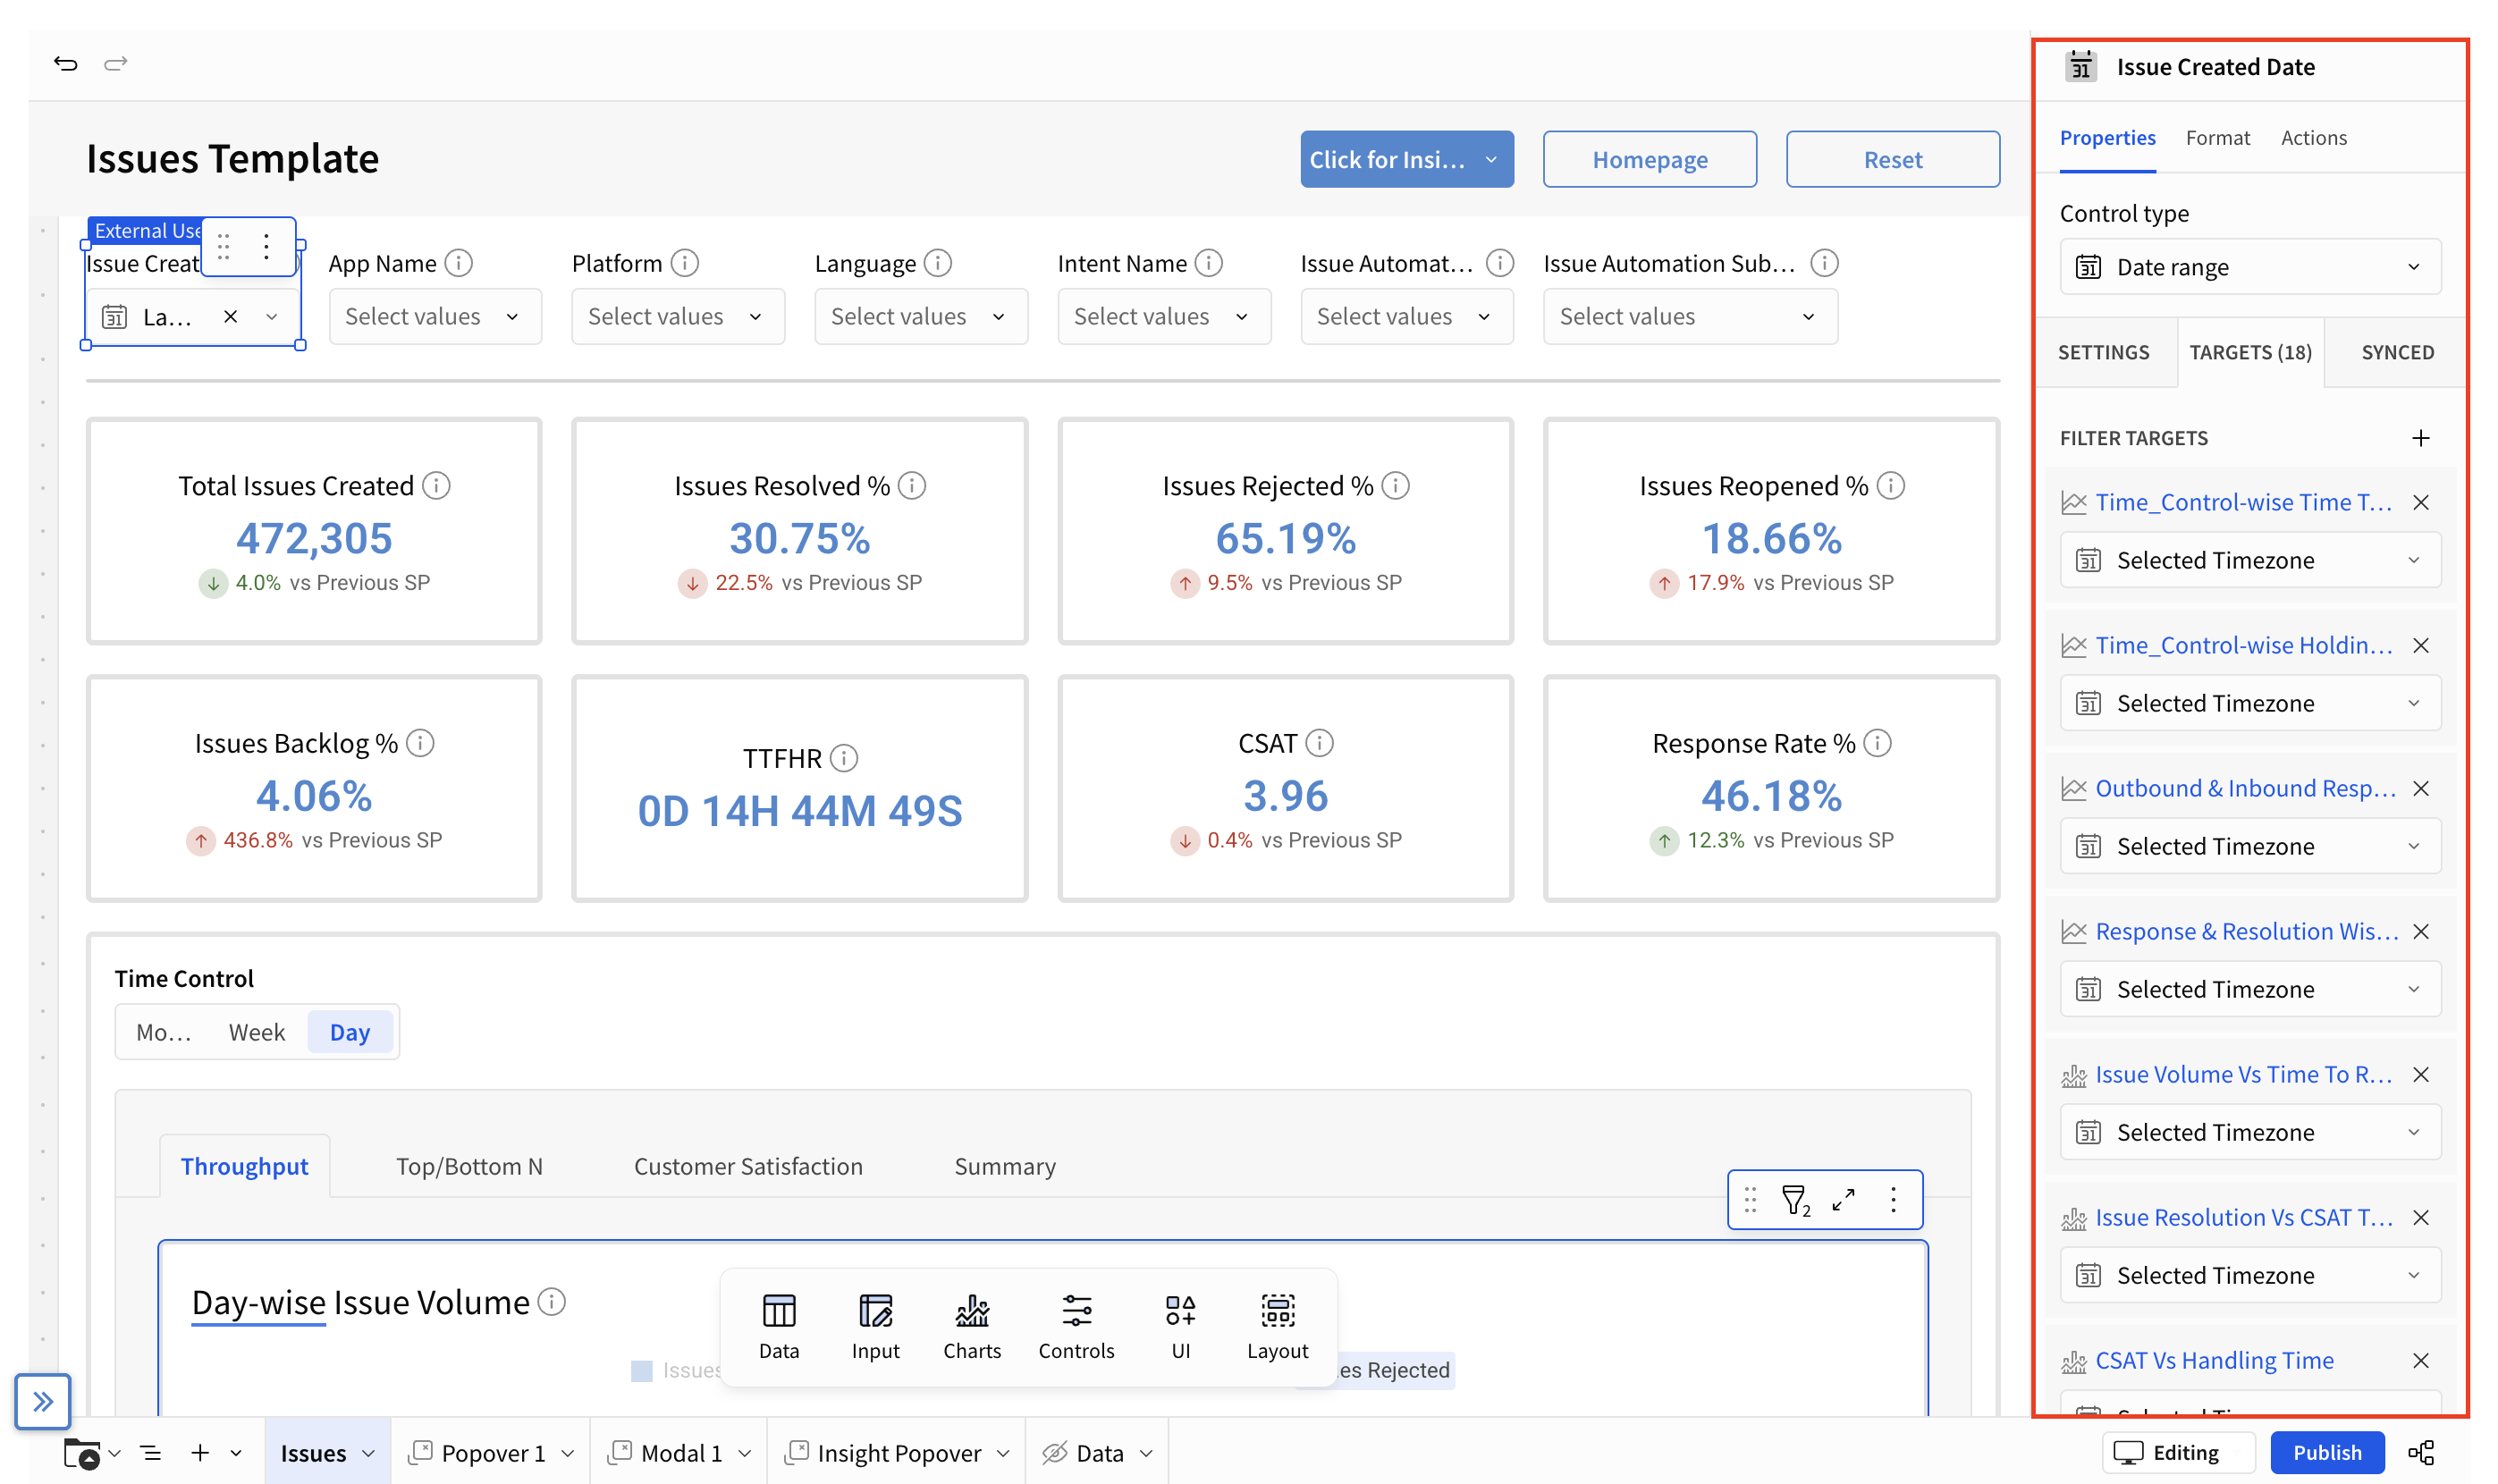
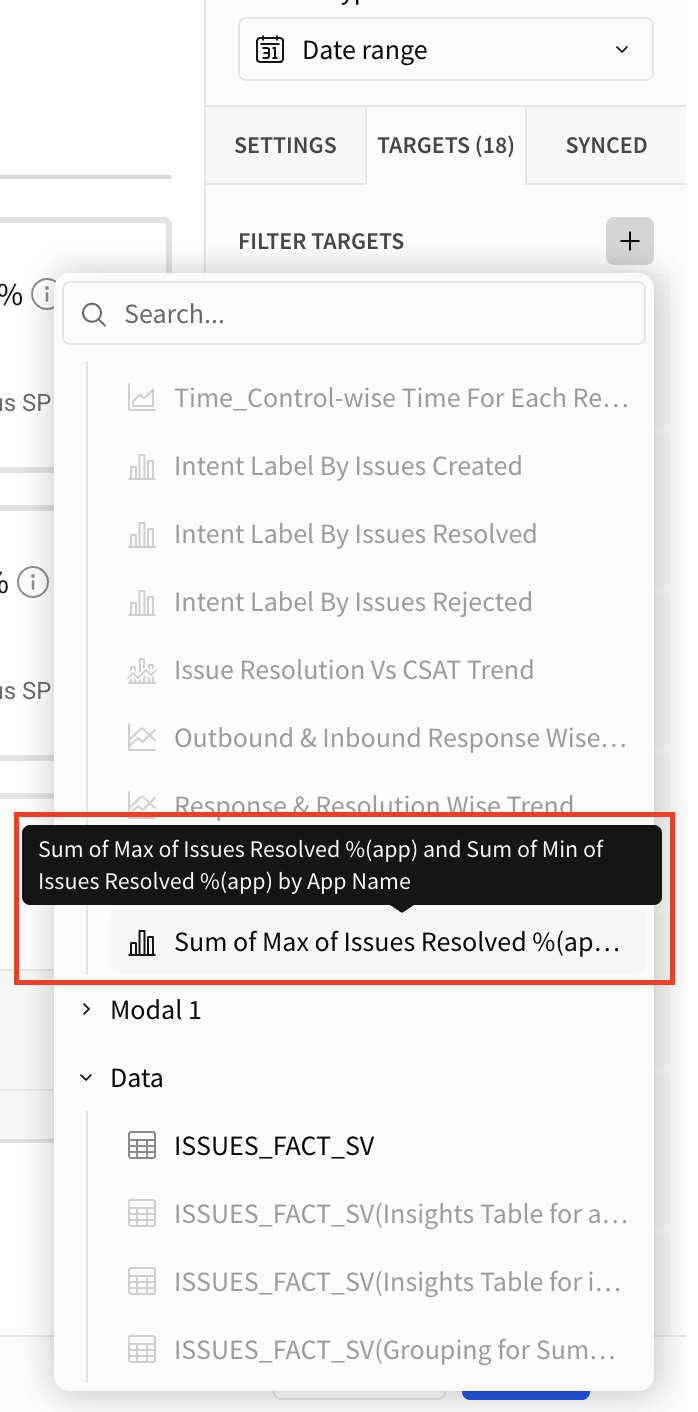
- Click the (+) icon near the FILTER TARGETS to link a new chart to the filter.
- Select the chart report that you have created.
This allows the Date range to actively filter your new data.
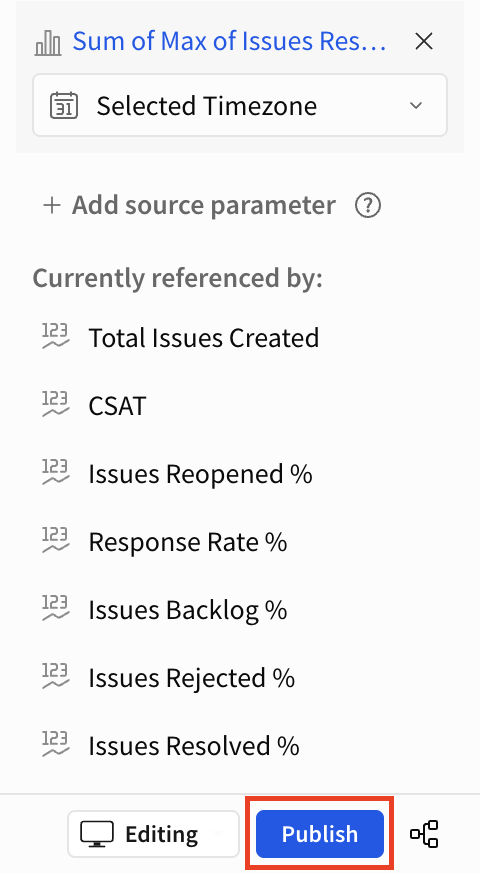
- Re-select the Date range and check the Target tab to verify that the visual title correctly maps to the Selected Timezone. If it is not mapped, you can manually select the Timezone column from the dropdown options.
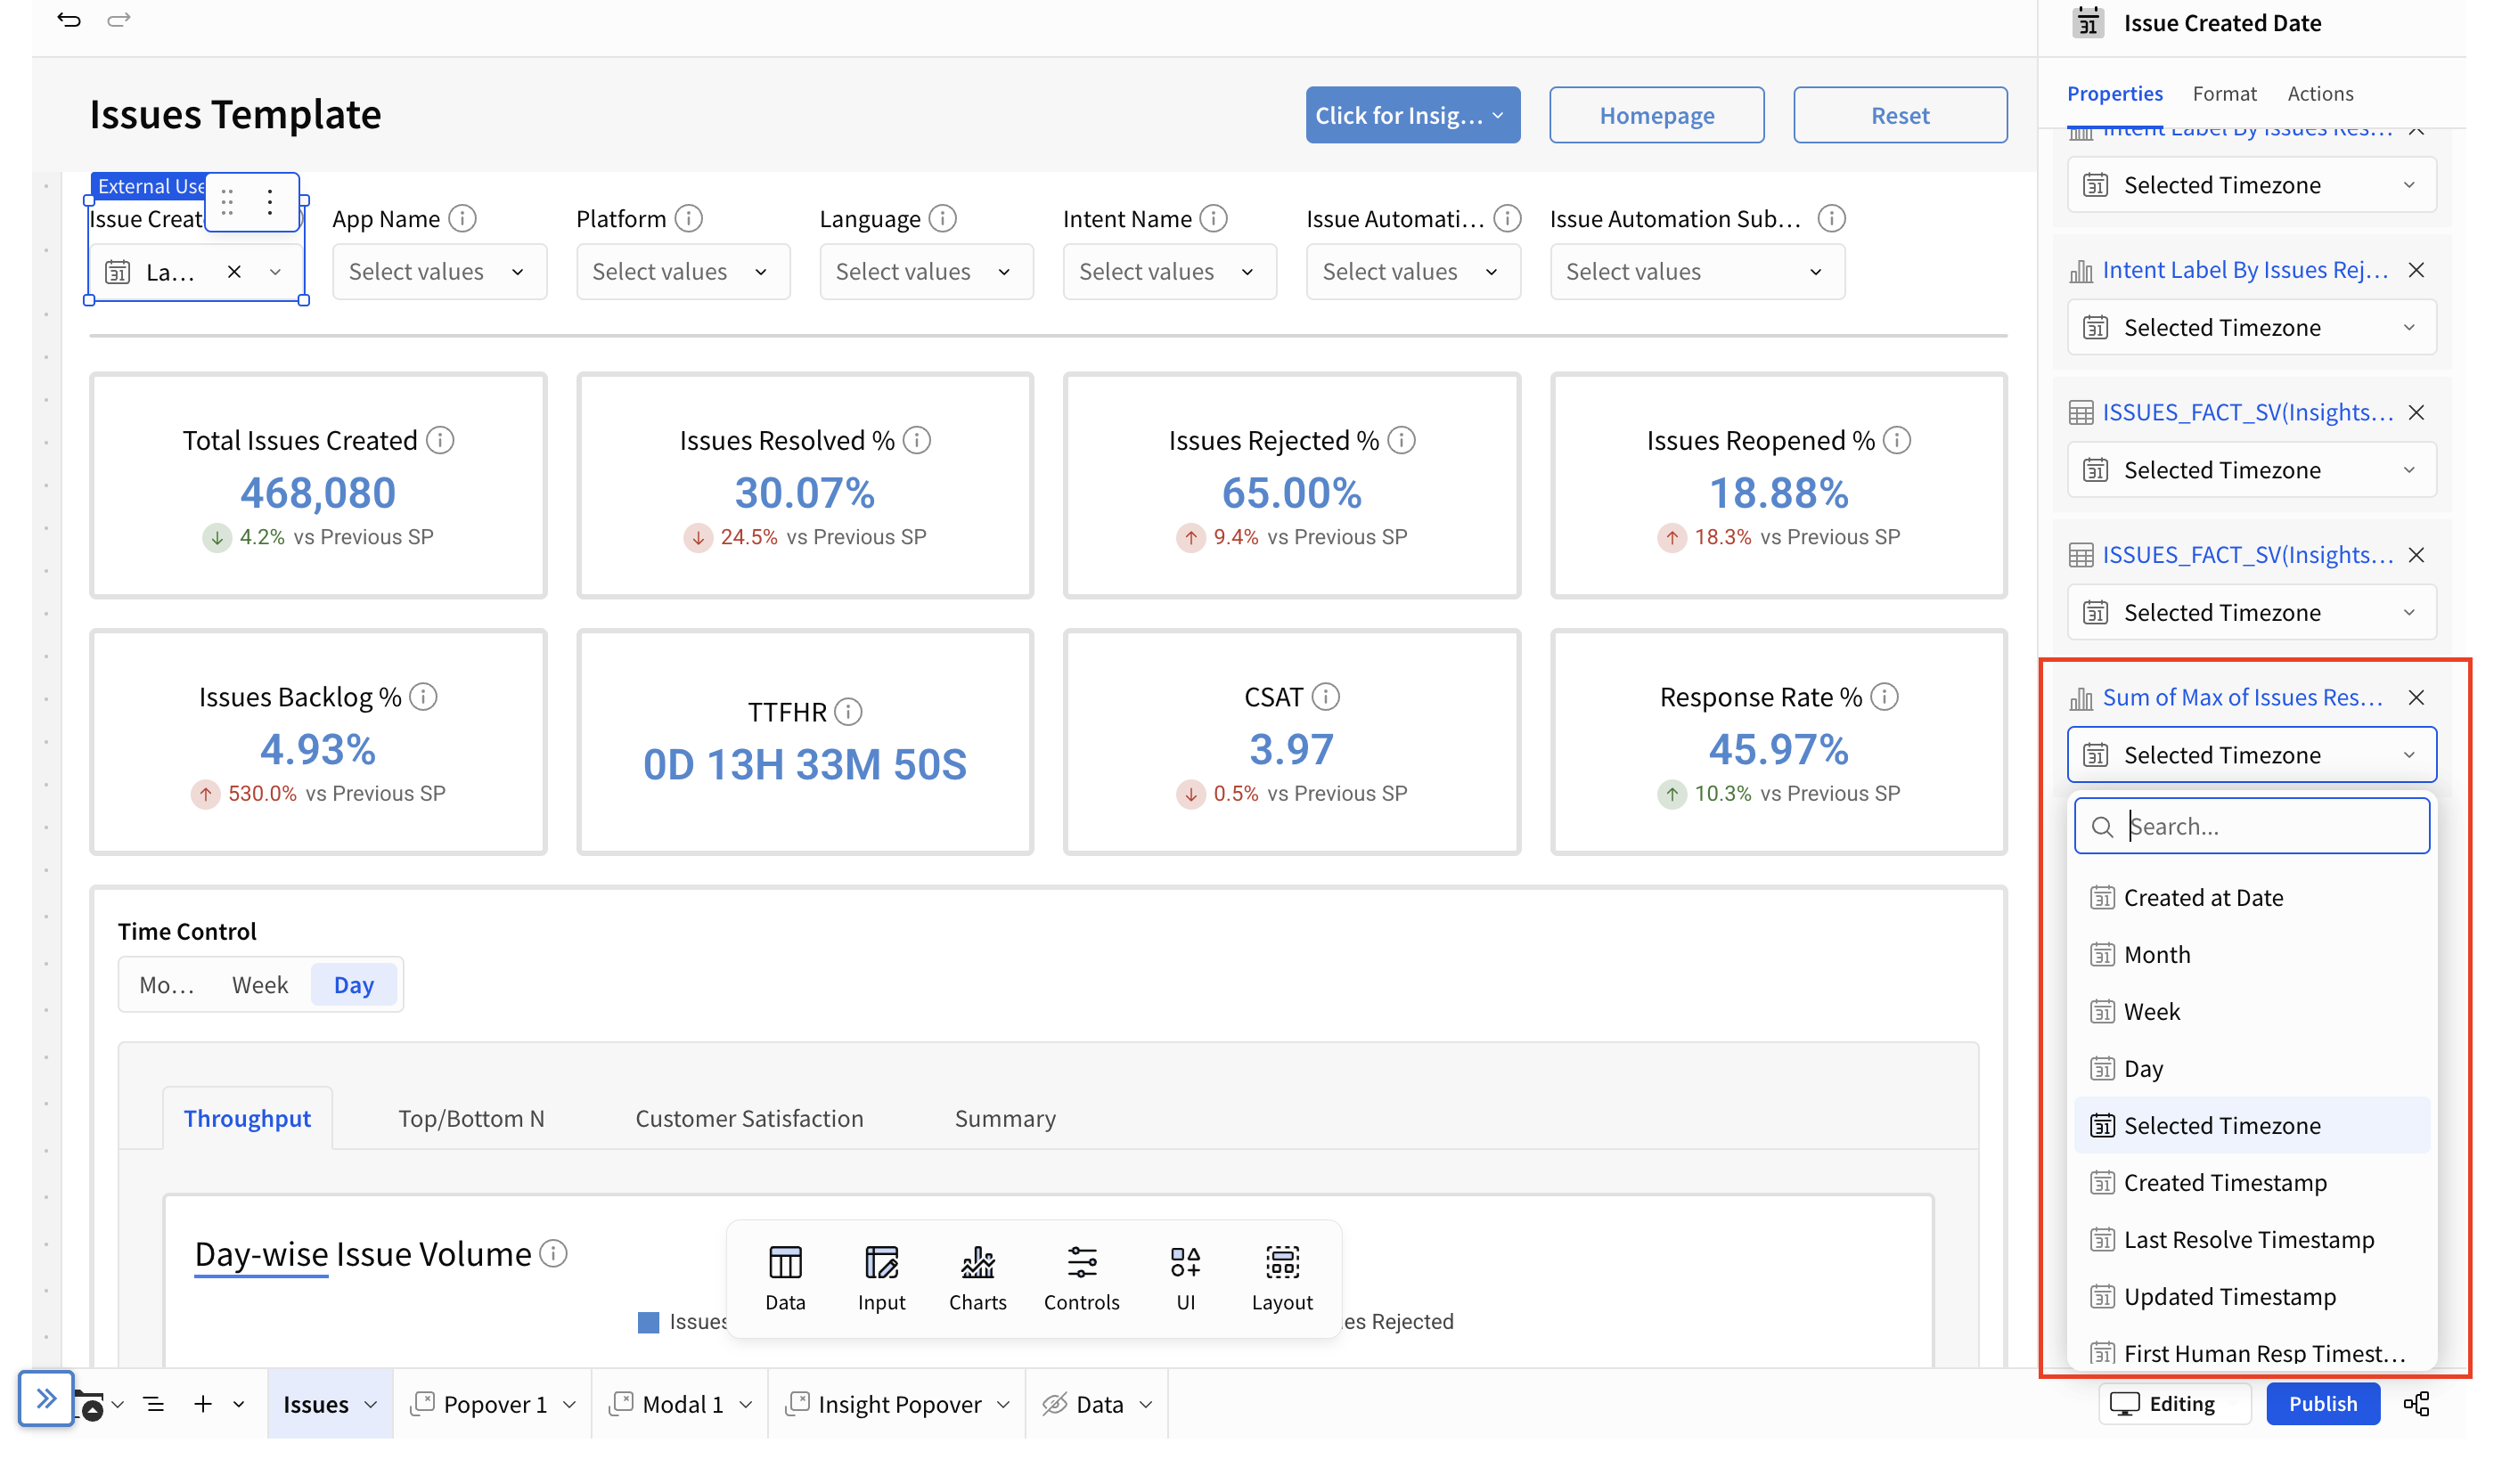
- Once you are ready with your chart, click Publish to save your custom chart.
Recovering a Draft
If you were working on a custom report but did not save or publish it, you can recover your draft using saved custom views:
- Click the Bookmark icon in the bottom-right corner of the screen.
- Select Manage Saved Views from the menu.
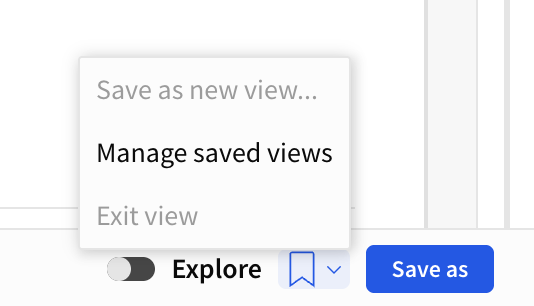
- Click the Custom Views tab.
- Select the timestamped draft you were previously working on to restore your session.
Viewing Custom Reports
If your Helpshift Custom Analytics account access is set to Viewer, you can easily access the custom reports created by your team by following these steps:
- Log in to your Helpshift domain as a Viewer.
- Navigate to Analytics.
- Under CUSTOM ANALYTICS, click the Custom Reports tab.
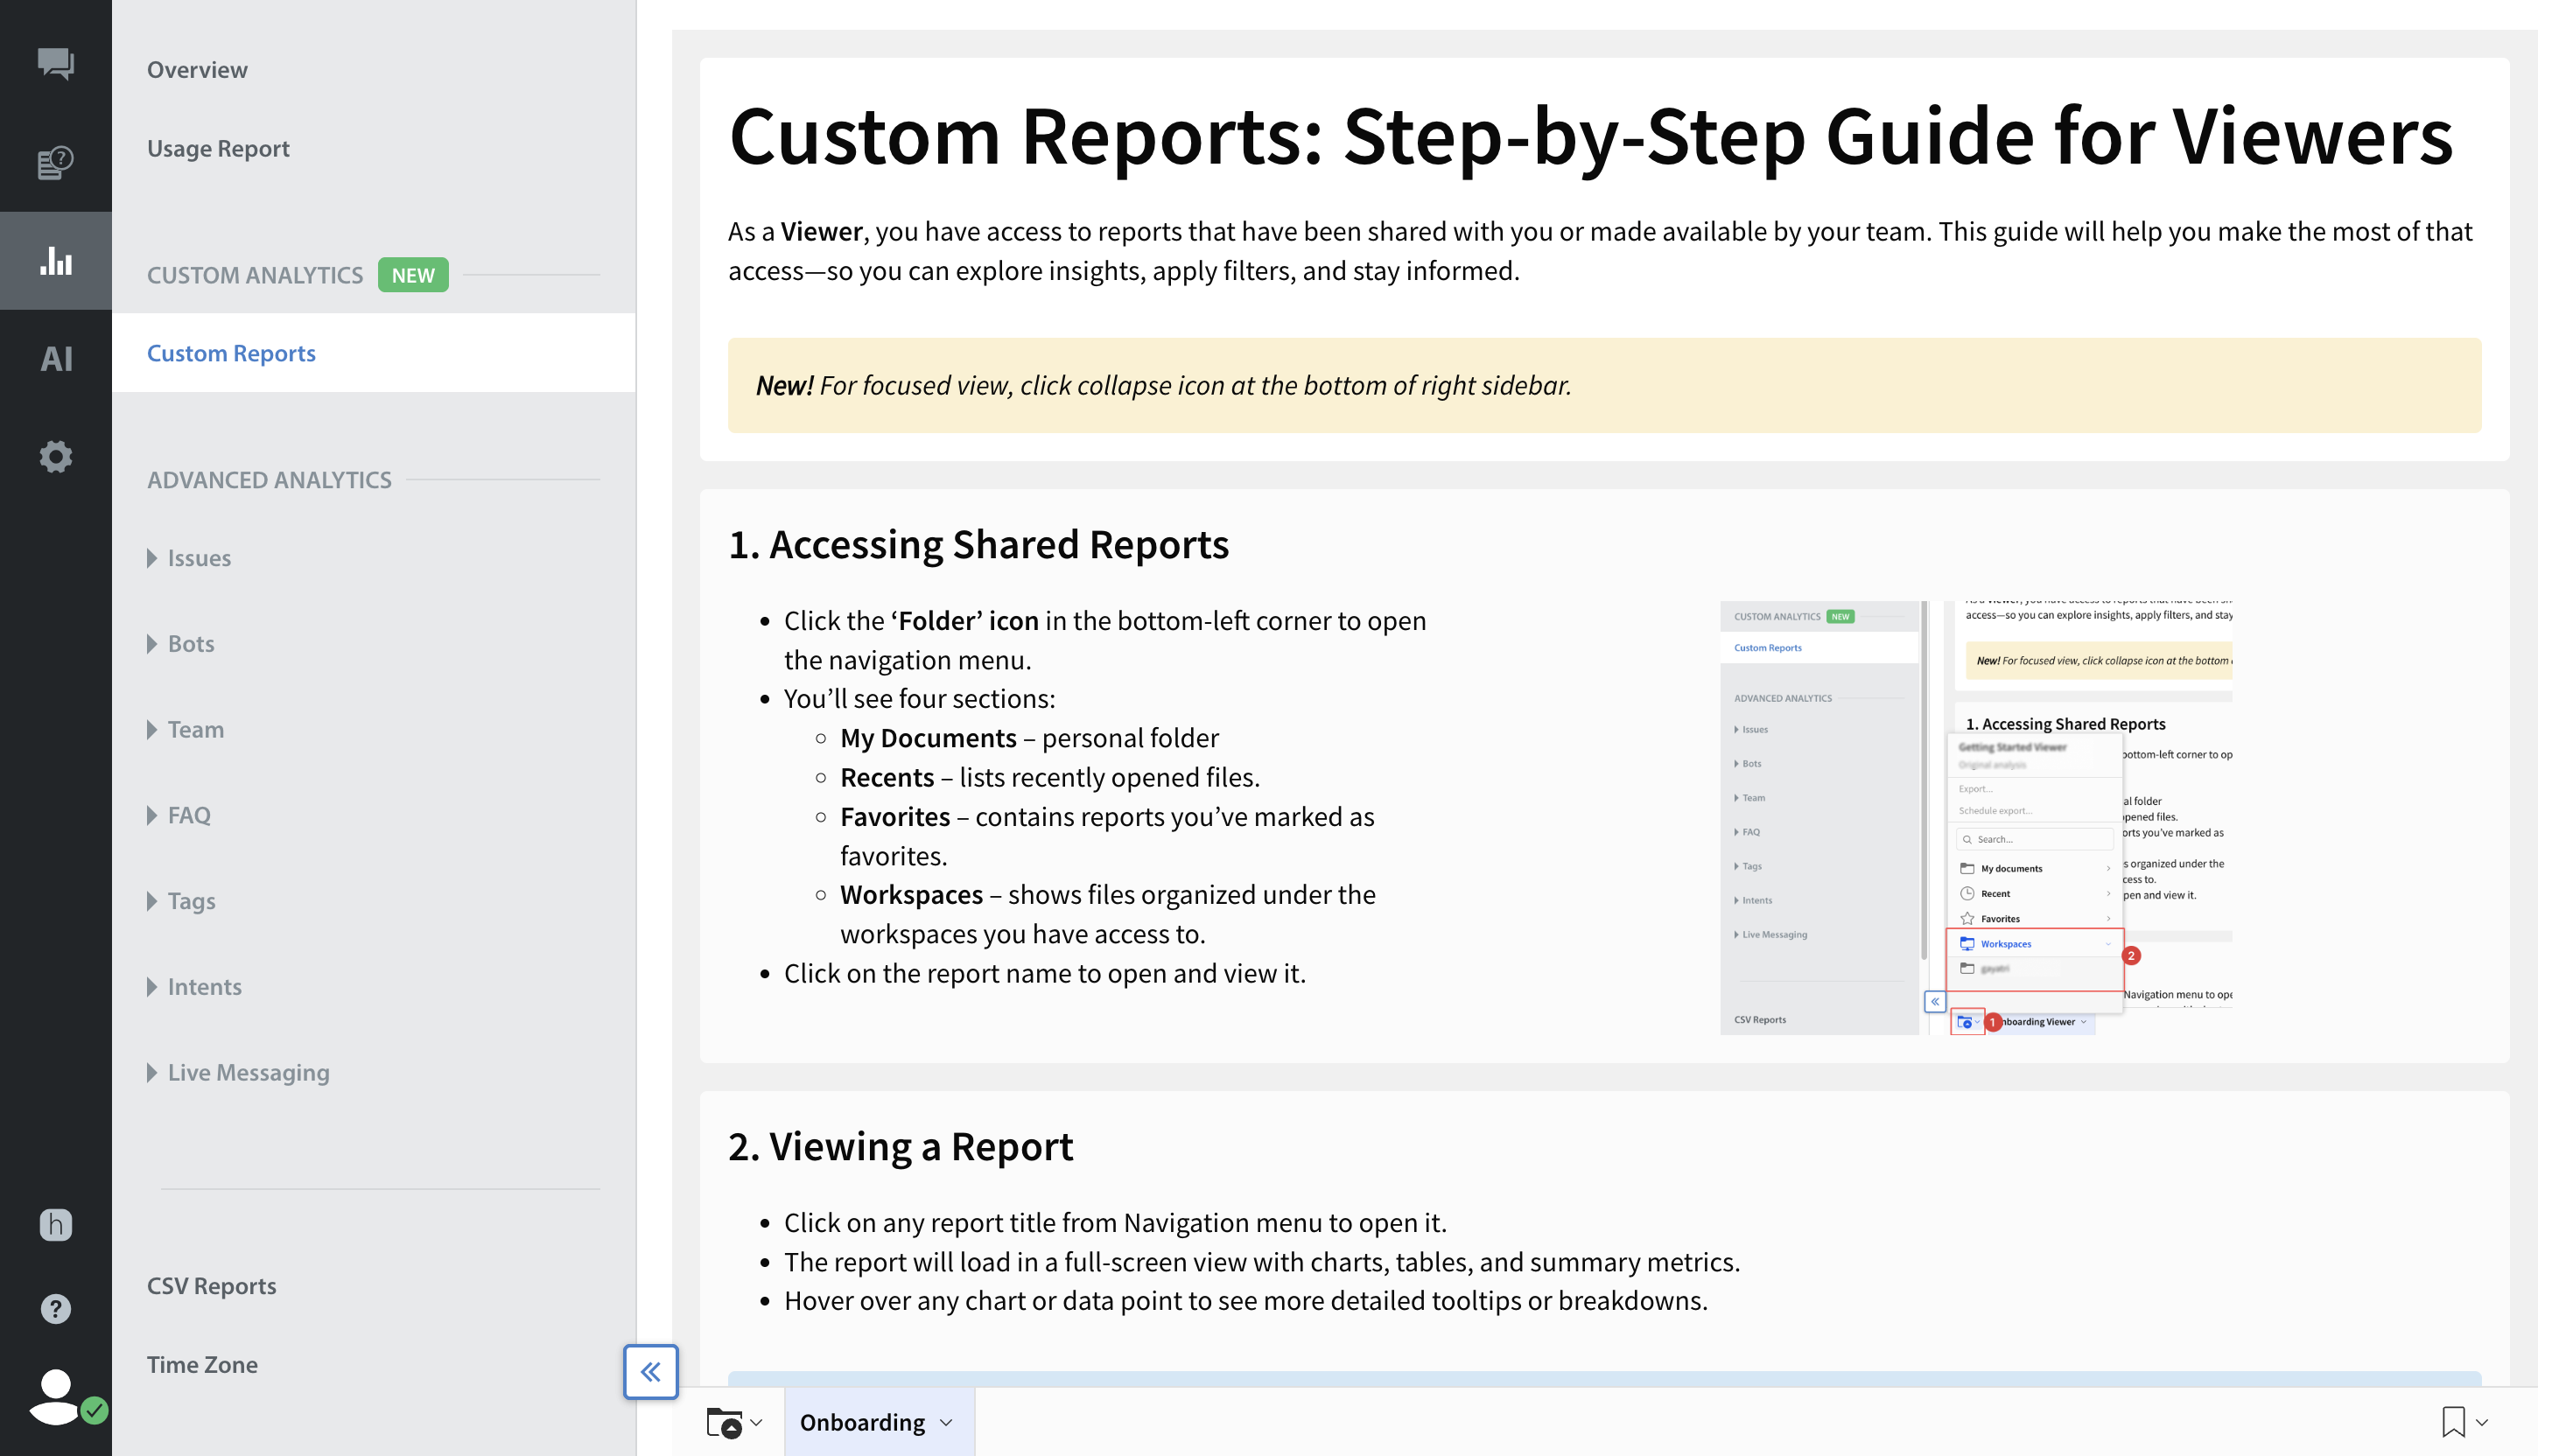
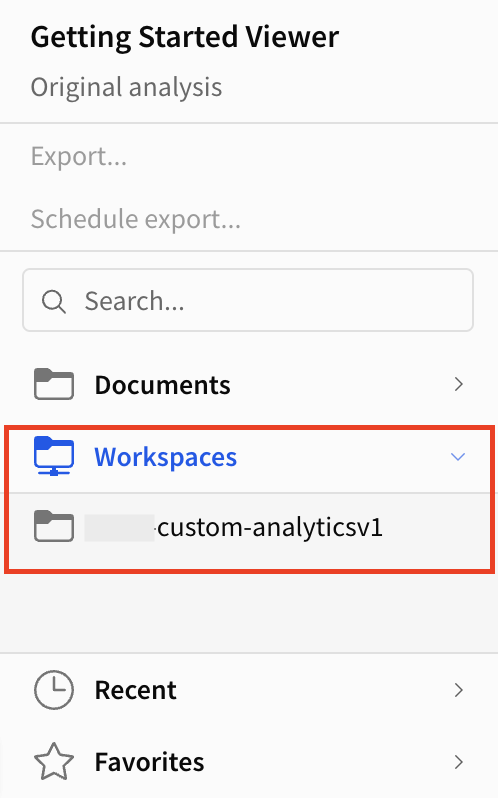
- Scroll down to the bottom of the screen and click Folder.
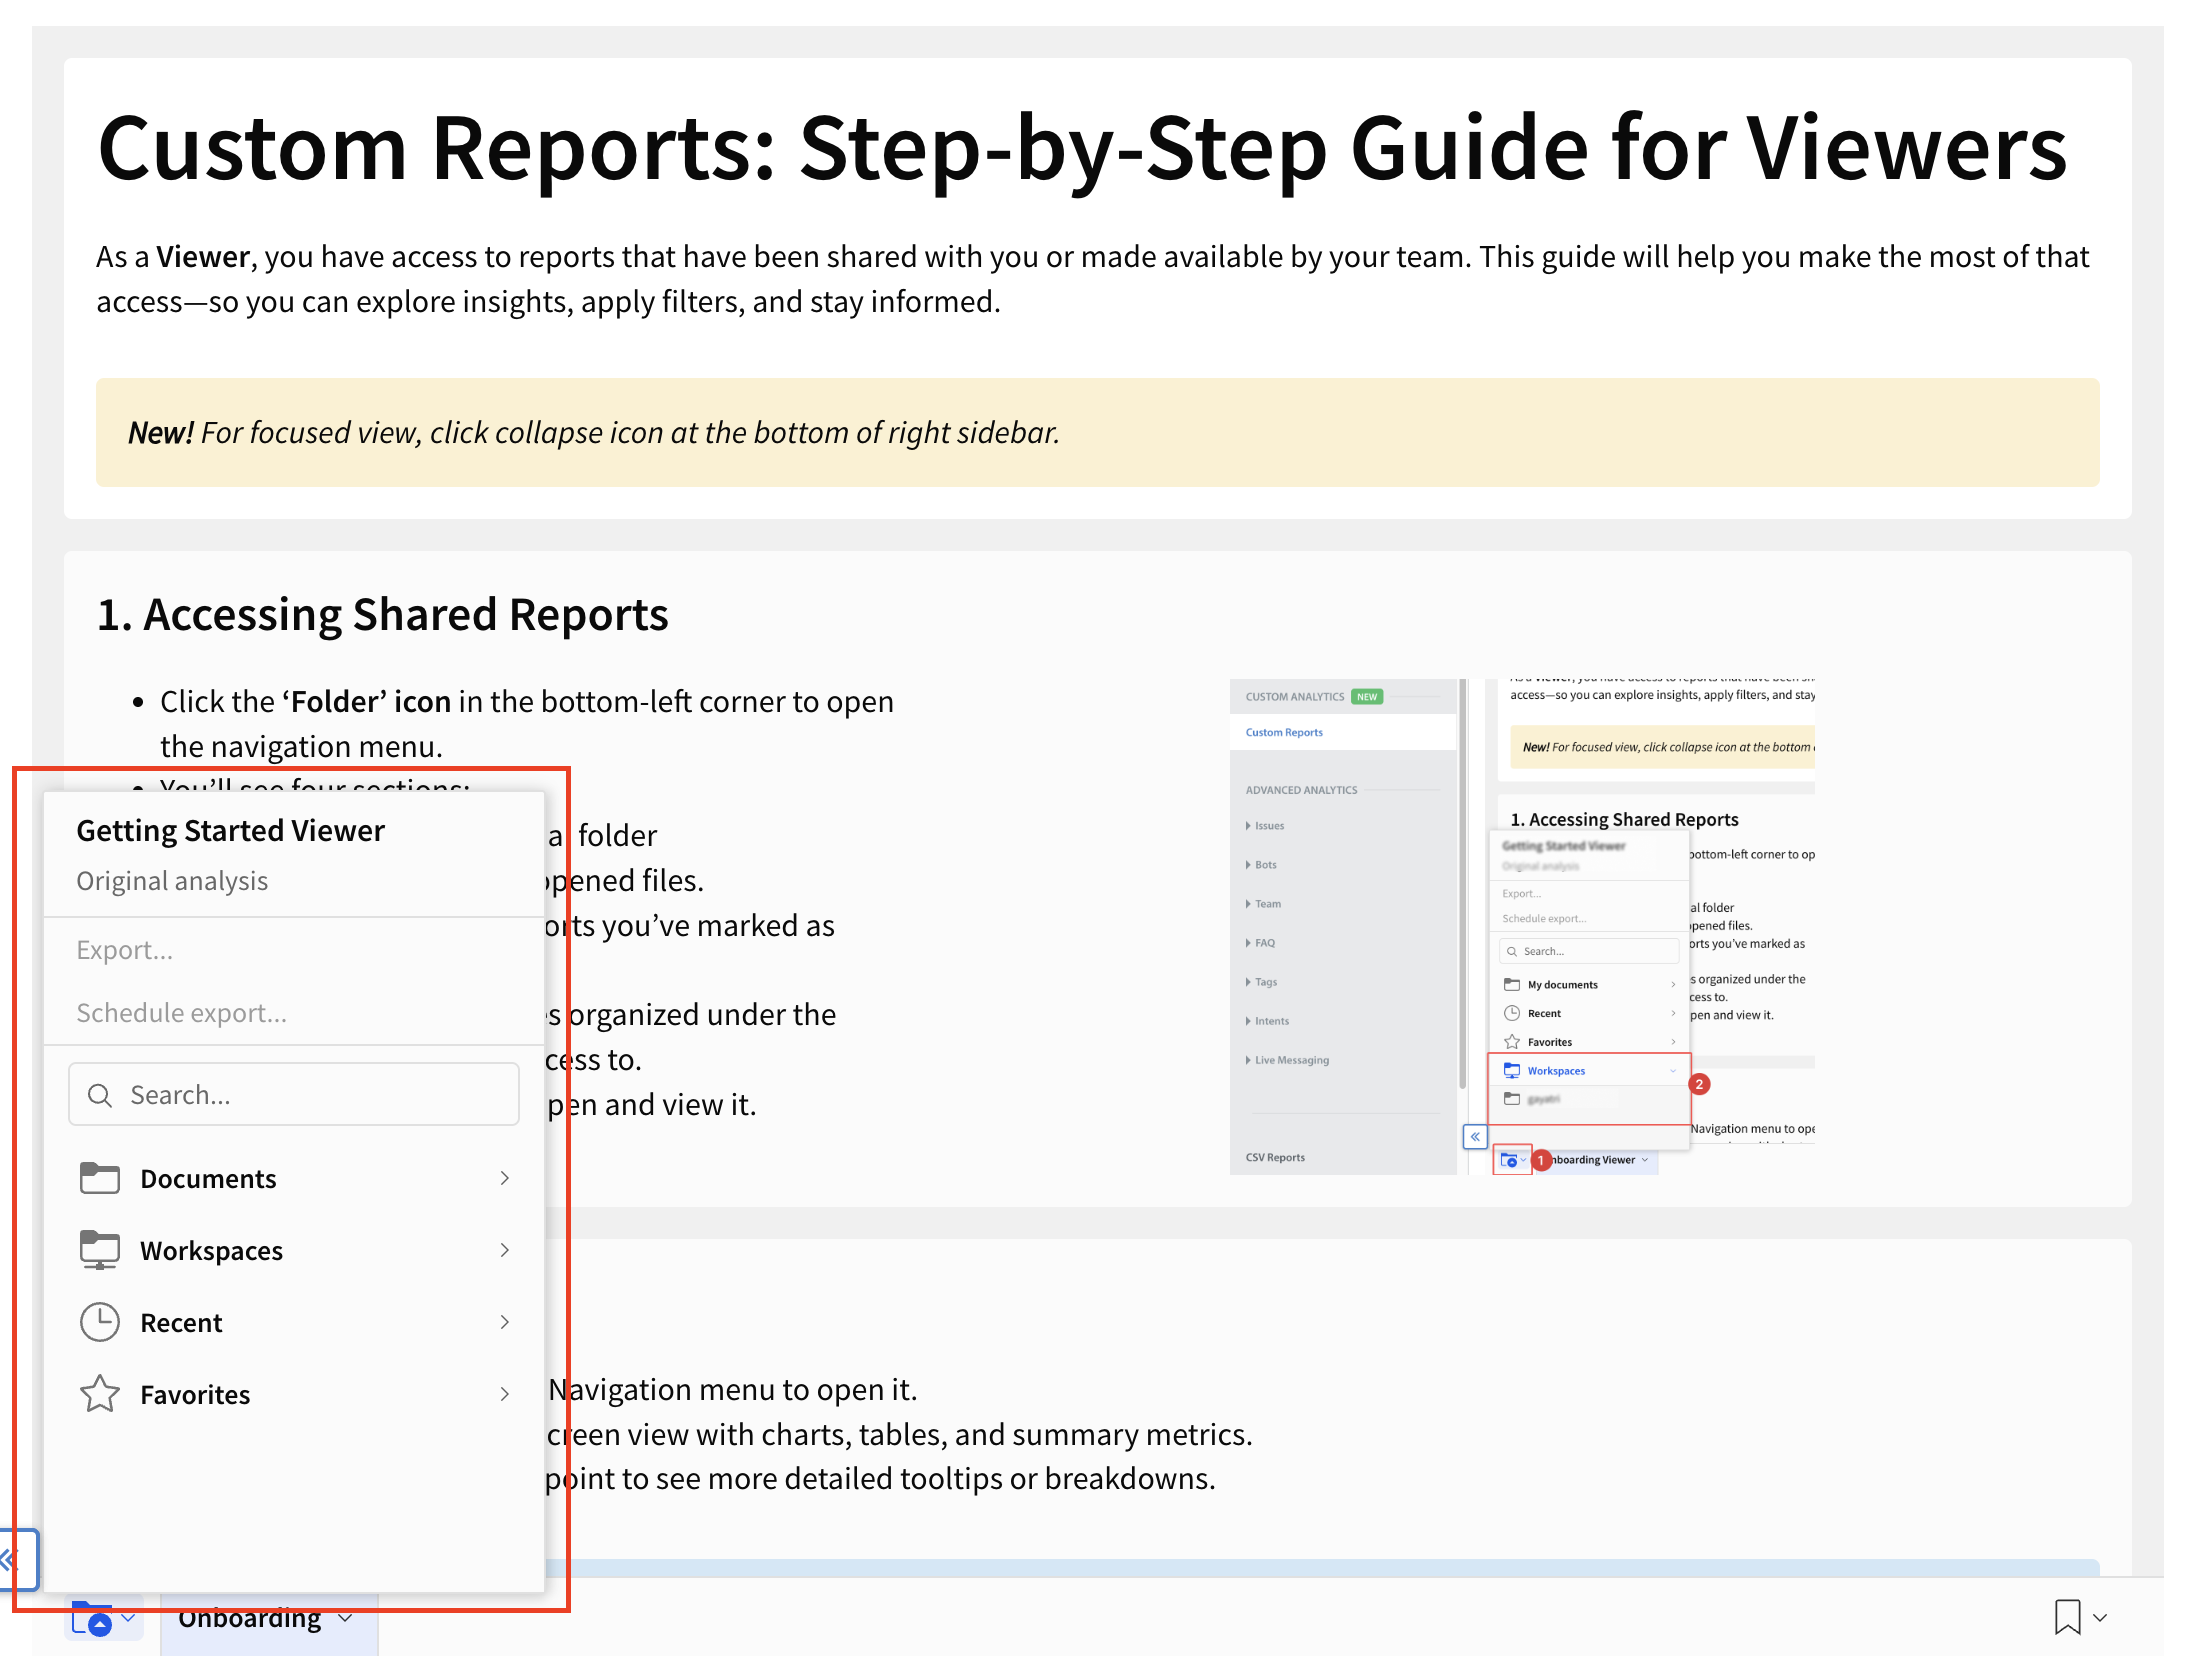
- Select Workspaces from the folders provided.
You will see a list of workspaces that you have been granted access to. - Click the Workspaces.
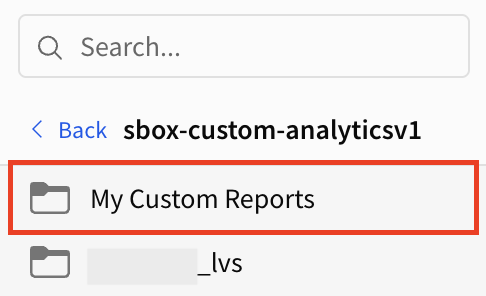
- Open the folder of the Workspace (e.g., "My Custom Report").
- Inside the folder, click the report for which you have the viewer access.
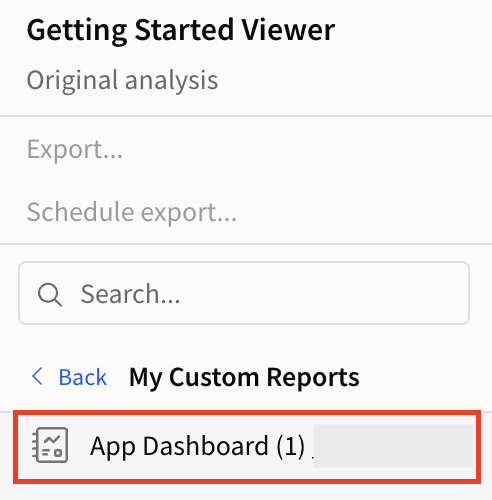
- You can now view the report created by your team.
Best Practices for End User Experience
- Decouple the Source: Ensure your template uses the Data Model as the source rather than direct SQL.
- The "Workhorse" Page: Create a hidden or background page in the template that contains the primary Data Source, i.e., the Data tab.
- This table should include all necessary calculated fields, filters, and formatting.
- Report creators will use this specific data table tab as the "Source" for their new visuals to ensure data consistency.
Note: If you only have a Viewer license, you cannot edit the parent Data Model. If you are building a report and need a new raw column, you must request it from your Admin.