
The Interactions template tracks key engagement and support metrics, providing teams with a complete view of support performance and customer satisfaction.
Note: To learn how to access and use the Interactions template, refer to the Getting Started guide.
Exploring Interactions Template
You can refine the data in your template using several filters:
| Filter Name | Column | Applicable to Metrics |
| Date | UTC_TIME | ALL |
| App Name | APP_NAME | ALL |
| Platform | PLATFORM | ALL |
| Language | LANGUAGE | ALL |
Note: Use the Time Control at the bottom of the overview section to dynamically update all charts and tables below. You can adjust the data display by:
Day: Track short-term fluctuations and daily performance.
Week: Highlight weekly patterns (starts on Sunday).
Month: View a high-level summary (starts on the 1st).
This flexibility enables you to quickly switch between insights, making it easier to identify trends over time.
| Metric | What does it measure? | How do we calculate it? |
| FAQ Searches | Number of times FAQ are being searched | Sum ([Total Search Count]) |
| Search Rate Failure | FAQ searches that turned up no results | Sum([No Faq Result Count]) / Sum([Total Search Count]) |
| FAQ Views | Number of times FAQ Views | Sum ([Faq View Count]) |
| Failed Deflection | Count of FAQ views that resulted in an issue being created within 15 minutes | Sum([Failed Faq Deflection Count]) |
| Total Issues Created | No. of Issues created in the selected time period | Sum([Issues Created Count]) |
| Issues Resolved % | Shows the percentage of Issues Resolved within the selected time period | Sum([Issue Resolves Count]) / Sum([Issues Created Count]) |
| TTR | Average time taken to resolve an issue from the time it was created | Text(Floor(Zn(Sum([Time to Resolve Sum Ms]) / Sum([Time to Resolve Count])) / 86400000)) & "D " & Text(Floor(Mod(Zn(Sum([Time to Resolve Sum Ms]) / Sum([Time to Resolve Count])), 86400000) / 3600000)) & "H " & Text(Floor(Mod(Zn(Sum([Time to Resolve Sum Ms]) / Sum([Time to Resolve Count])), 3600000) / 60000)) & "M " & Text(Floor(Mod(Zn(Sum([Time to Resolve Sum Ms]) / Sum([Time to Resolve Count])), 60000) / 1000)) & "S" |
| CSAT | Avg. CSAT for all issues that received the CSAT rating | Sum([Csat Sum]) / Sum([Csat Count]) |
| FAQ Search wise Trend | Shows the volume of total search and FAQ searches with no result over time | Total Search= Sum ([Total Search Count]) No Result FAQ= Sum([No Faq Result Count]) |
| FAQ Views Vs Failed Deflection Rate | Shows visual comparison of how often users are accessing the FAQ content versus how often it fails to resolve their queries | FAQ Views= Sum([Faq View Count]) Failed Deflection Rate= Sum([Failed Faq Deflection Count])/(Sum([Failed Faq Deflection Count])+Sum([Successful Faq Deflection Count])) |
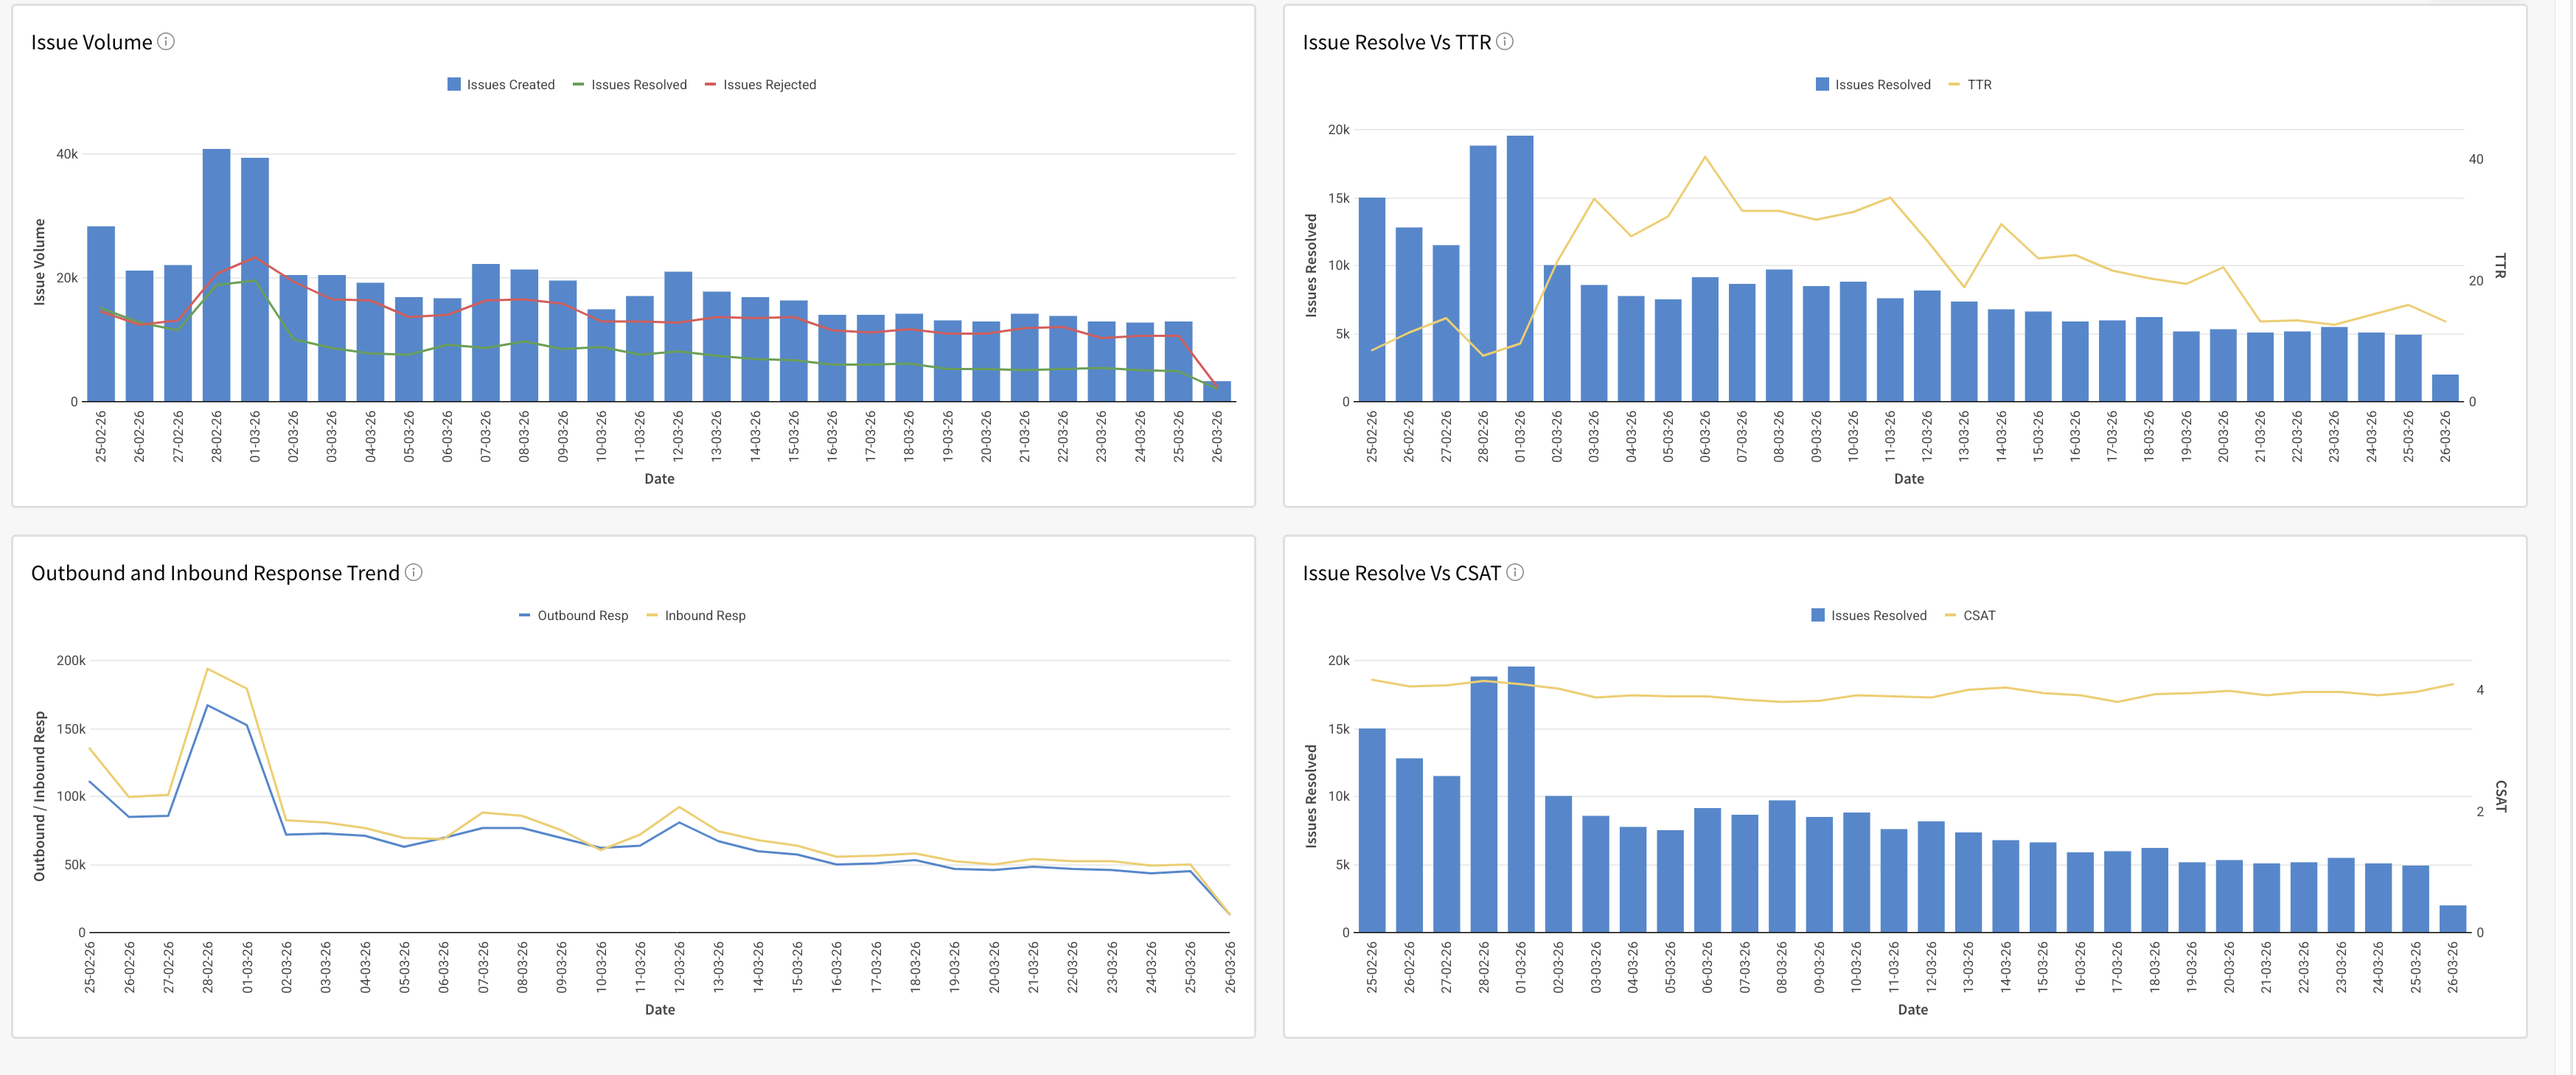
| Issue Volume-wise Trend | Shows the trend of issues created, rejected and resolved over time, helping track issue volume, resolution efficiency, and recurring problem patterns | issues created = Sum([Total Issues Created]) rejected =Sum([Issue Rejects Count]) resolved=Sum([Issue Resolves Count]) |
| Issue Volume Vs TTR | Shows the trend of issues resolved alongside the average time to resolve over time, helping track efficiency | issues created =Sum([Total Issues Created]) TTR =(Sum([Time to Resolve Sum Ms]) / Sum([Time to Resolve Count])) / 3600000 |
| Outbound and Inbound Response-wise Trend | Shows the trend of outbound and inbound responses over time, tracking communication volume sent to and received from users | Outbound = Sum([Outbound Resp Count]) Inbound = Sum([Inbound Resp Count]) |
| Issue Resolution Vs CSAT Trend | Shows the trend of issues resolved versus CSAT rating over time, highlighting how the resolution of issues impacts customer satisfaction | issues Resolved = Sum([Issue Resolves Count]) CSAT =Sum([Csat Sum]) / Sum([Csat Count]) |
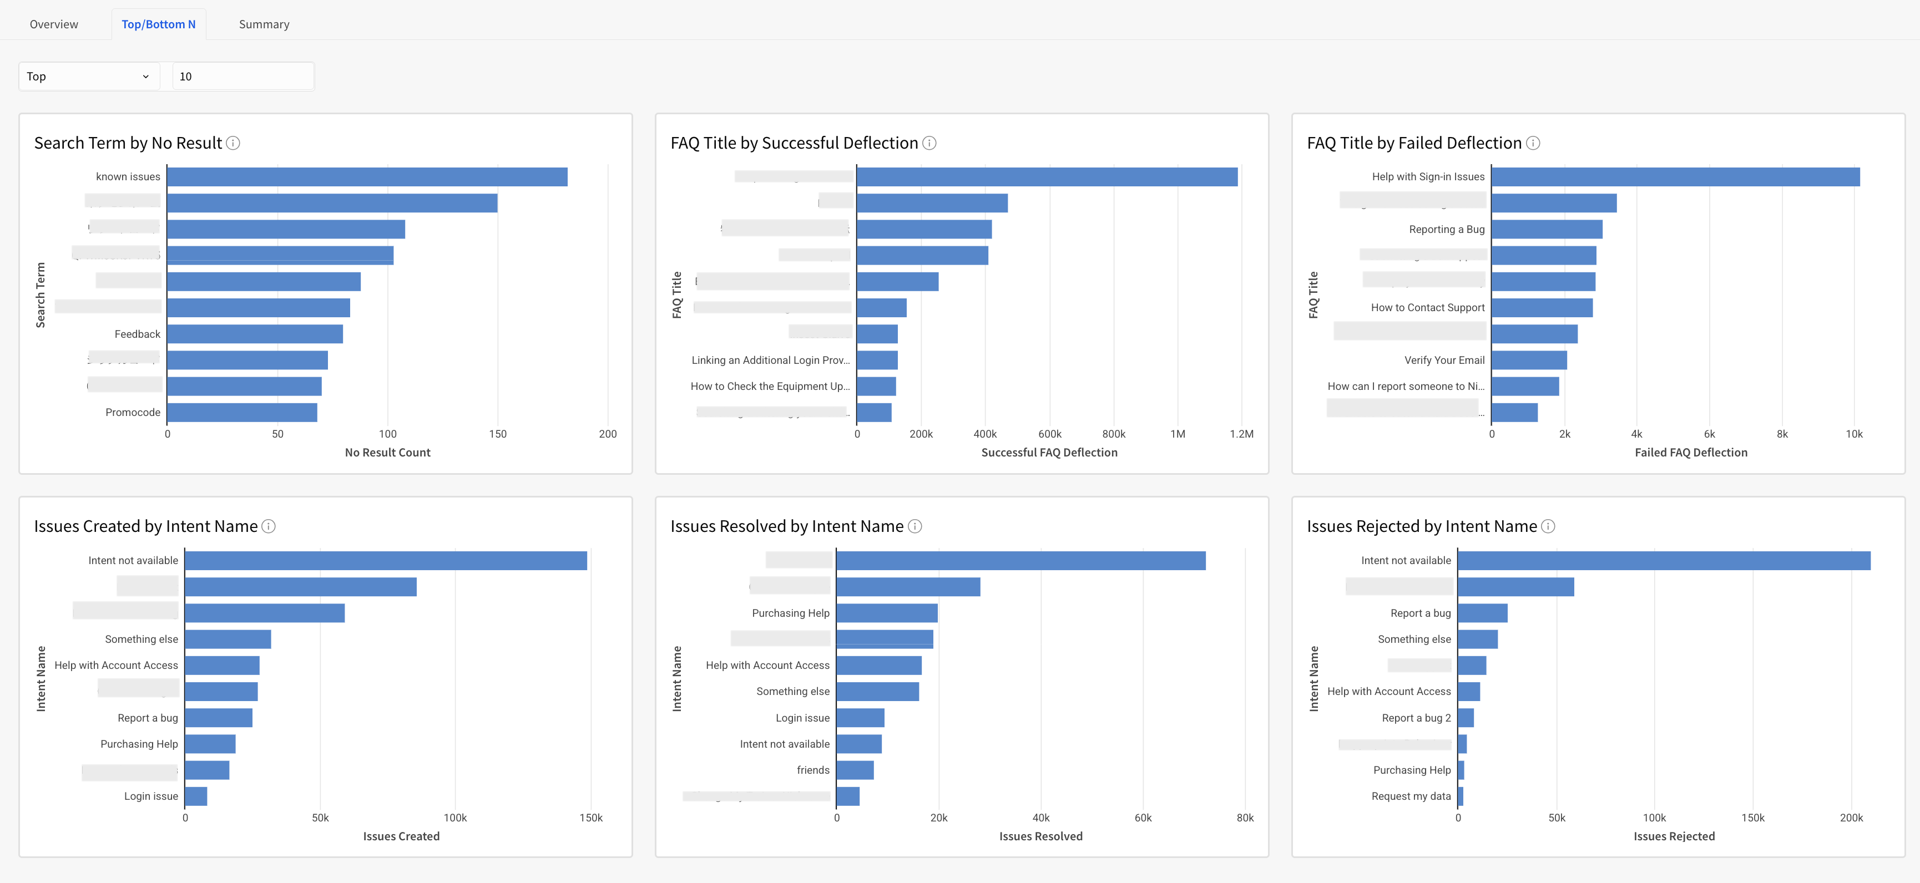
| Top/Bottom N Search Term by No result | Shows the top/bottom N search terms with No Results, helping identify gaps in FAQ content and determine which new FAQs need to be created | Sum([No Faq Result Count]) |
| Top/Bottom N FAQ Title by Failed Deflection | Shows the top/bottom N FAQ Title with failed deflections, helping identify which articles are failing to resolve user queries and leading to issue creation within 15 minutes of being viewed | Failed Deflection=Sum([Failed Faq Deflection Count]) |
| Top/Bottom N FAQ Title by Successful Deflection | Shows the top/bottom N FAQ Title with the successful deflections, helping identify which articles are most effective at resolving user queries and preventing issue creation within 15 minutes of being viewed | Successful Deflection= Sum([Successful Faq Deflection Count]) |
| Top/Bottom N Issues Created by Intent Name | Shows the top and bottom N intent name by issues created, helping identify which user intents generate the most and least issues | issues created= Sum([Total Issues Created]) |
| Top/Bottom N Issues Resolved by Intent Name | Shows the top and bottom N intent name by issues resolved, highlighting which user intents are most successfully addressed | issues resolved=Sum([Issue Resolves Count]) |
| Top/Bottom N Issues Rejected by Intent Name | Shows the top and bottom N intent name by issues rejected, highlighting which user intents are most frequently rejected | Issues Rejected = Sum([Issue Rejects Count]) |
| Summary Table | A consolidated view of all metrics, grouped by date, to track performance trends and compare metrics across time periods at a glance | All the calculations are the same as the metric level calculation, and are put all together in Tables as a Summary |
Note: Metrics such as Active Users and Contact Rate rely on App Profile data. Please upgrade your SDK and integrate the new Identity Login API to enable App Profiles.
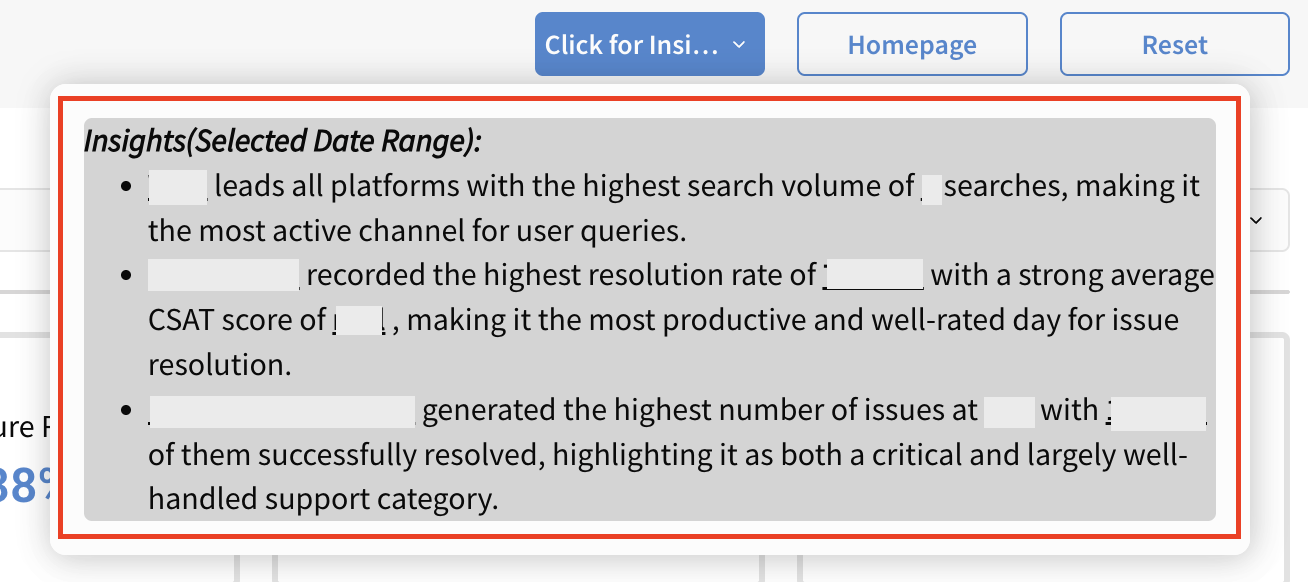
Pro Tip: Click the Click on Insight button to quickly view key insights from the report.
| Overview |
  |
| Top/Bottom N |
 |
Summary Section
All the metrics mentioned above are also available in table format in the Summary Section. You can also download the data for every table in various formats by clicking on the Export option.
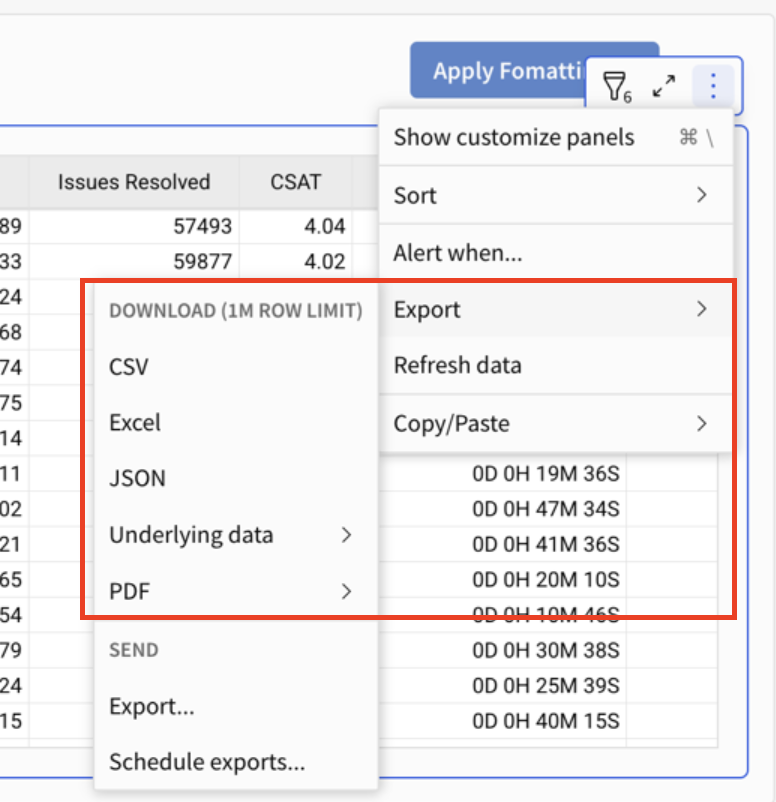
Pro Tip: Use Apply Formatting (top-right of the template) to instantly apply conditional formatting and highlight key metrics within the table. For example, you can set a rule to highlight values when the Search Failure Rate % exceeds 20, making it easier to spot trends and outliers at a glance.
Note: For search-related metrics, data is only available for the last 30 days (up to yesterday). This limit ensures privacy compliance by preventing the long-term storage of any Personally Identifiable Information (PII) entered in users' search queries.