
NOTE: Changes that you make to the metrics listed on the Real-Time Operations page are only reflected for your individual view. It does not affect the metrics displayed to other team members. Each individual team member can configure this setting for themselves.
To customize the metrics that are listed on this page, click the settings icon to the top right of the metric table you’d like to customize.
For our example, we’ll customize the metrics in the Queues table, though these exact same steps can be used to update the metrics in the Teams table.
![]()
In the pop-up that appears, navigate to the ‘Metrics’ tab by clicking on it.
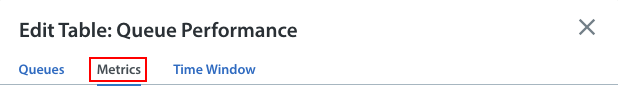
On this page, all of the metrics (listed as columns) available to display on the Real-Time Operations page are listed. Use the toggles to the right of each metrics to enable or disable the display of this metric on the Real-Time Operations page.
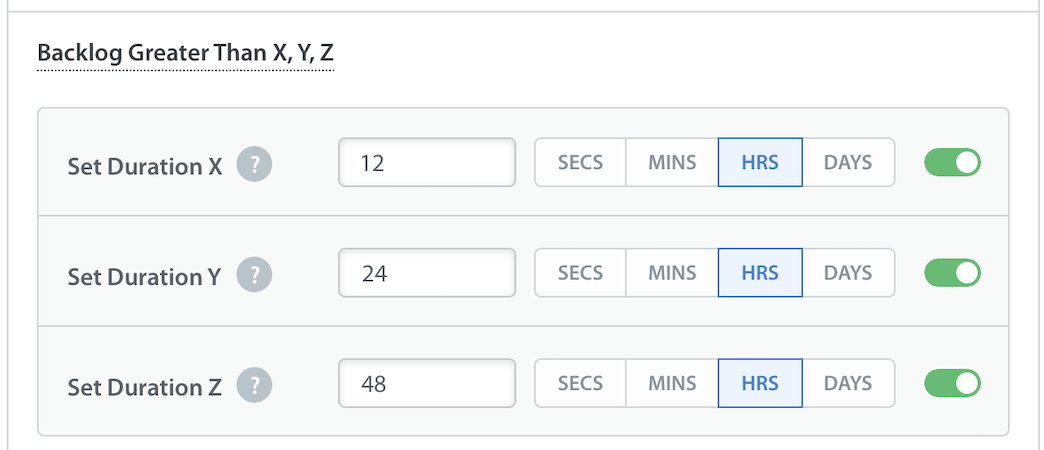
Backlog Greater Than X
The Backlog Greater Than X, Y, Z metric displays the time-based settings along with the toggles. By default, each time field has preset values – 12 hours, 24 hours, and 48 hours respectively. However, you can change and set the value for each field as per your need. You can use this metric to track Issues that are pending assignment.
You can configure up to three time-based thresholds to track backlogs.
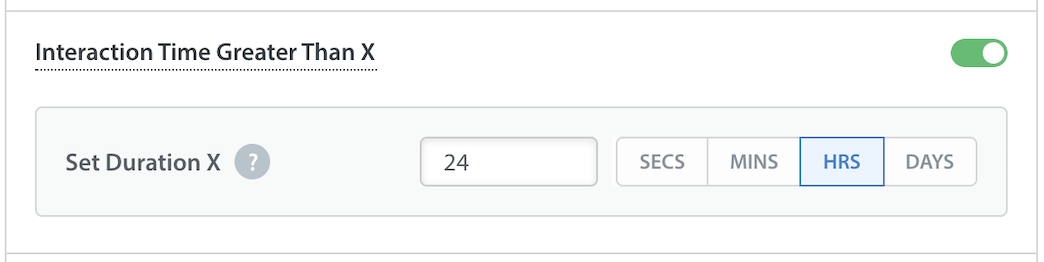
Interaction Time Greater Than X
You can set up time-based thresholds for Interaction Time. Also, you can customize the time fields for Interaction Time Greater Than X metric in seconds, minutes, hours, and days.
Once you click Save, your Real-Time Operations Dashboard will be updated to display the changes you made.