
Once your campaign has been sent, you can use the Delivery & Engagement Overview to track how your message performed after it was sent. This dashboard provides comprehensive analytics to help you measure the exact reach, delivery status, and user interaction of your campaign messages.
View Metrics by Platform
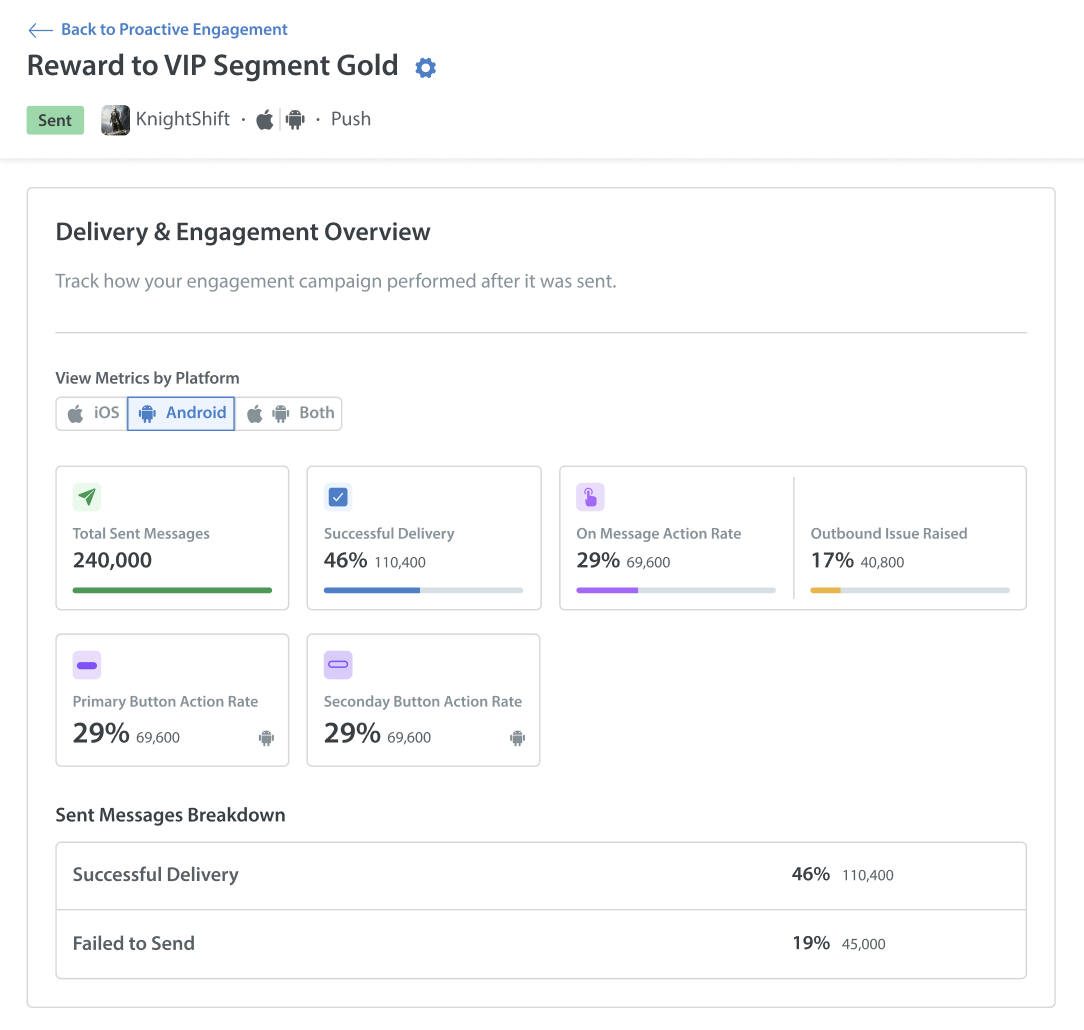
To analyze performance across specific operating systems, navigate to the View Metrics by Platform section. You can filter all your campaign data by clicking the toggle buttons for iOS, Android, or Both.
The dashboard also features a visual grid of summary cards displaying the exact user count and percentage for your key performance indicators:
- Total Sent Messages: The absolute number of messages that were triggered and dispatched to your targeted audience.
- Successful Delivery: The rate of messages that safely reached the users' devices.
- On Message Action Rate: The rate of users who directly engaged with the message.
- Outbound Issue Raised: The rate of users who submitted a new support ticket for this engagement campaign.
- Primary & Secondary Button Action Rate: The specific engagement rates for the call-to-action buttons configured in your layout.
Sent Messages Breakdown
The Sent Messages Breakdown section provides a detailed list view of your delivery outcomes. It displays both the percentage and the exact user count for the following:
- Successful Delivery: The number of messages that safely reached the users' devices.
- Failed to Send: The number of messages that could not be delivered.
Notes: Delivery metrics are updated every 24 hours.