The Players template tracks global player acquisition and engagement across all platforms, providing insights into growth and retention.
Note: To learn how to access and use the Players template, refer to the Getting Started guide.
Exploring Players Template
You can refine the data in your template using several filters:
| Filter Name | Column | Applicable to Metrics |
| Date | CREATED_TIMESTAMP | ALL |
| App Name | APP_NAME | ALL |
| Platform | PLATFORM | ALL |
| Language | SF LANGUAGE | ALL |
| Country | SF COUNTRY | ALL |
| User VIP Segment | SF USER VIP SEGMENT | ALL |
Note: Use the Time Control at the bottom of the overview section to dynamically update all charts and tables below. You can adjust the data display by:
- Day: Track short-term fluctuations and daily performance.
- Week: Highlight weekly patterns (starts on Sunday).
- Month: View a high-level summary (starts on the 1st).
This flexibility enables you to quickly switch between insights, making it easier to identify trends over time.
Detailed information on each metric is given below:
| Metric | What does it measure? | How do we calculate it? |
| Total New Users | No. of new Users Created(In Selected Period, if applied) | Count([Profile Id]) |
| Prev Month MAU | Date filter will not going to interact with this kpi | SumIf([Unique Users Count], [Day of Utc Date] = Max([Day of Utc Date])) |
| Platform Per User | The average number of unique platforms | Avg([Platforms Count]) |
| Prev Month Contact Rate% | Date filter will not going to interact with this kpi | SumIf([M Issue Created Count], [Day of Utc Date] = Max([Day of Utc Date])) / SumIf([Unique Users Count], [Day of Utc Date] = Max([Day of Utc Date])) |
| Issues Backlog % | Shows the percentage of pending Issues, representing the portion of created issues that are still unresolved or not rejected. | Sum([Issues Backlog]) / Sum([Issues Created Count]) where Issues Backlog =Sum([Issues Created Count]) - (Sum([Issues Resolved Count]) + Sum([Issues Rejected Count])) |
| CSAT | Avg. CSAT for all issues that received the CSAT rating | Sum([Csat]) / Sum([Count of Csat Timestamp]) |
| Human TTFR | Avg Time to First Response taken by Human | Text(Floor(Zn(Avg([Time to First Human Resp Ms])) / 86400000)) & "D " & Text(Floor(Mod(Zn(Avg([Time to First Human Resp Ms])), 86400000) / 3600000)) & "H " & Text(Floor(Mod(Zn(Avg([Time to First Human Resp Ms])), 3600000) / 60000)) & "M " & Text(Floor(Mod(Zn(Avg([Time to First Human Resp Ms])), 60000) / 1000)) & "S" |
| Time To Resolve | Avg Time to Resolve the Issue | Text(Floor(Zn(Avg([Time to Resolve Ms])) / 86400000)) & "D " & Text(Floor(Mod(Zn(Avg([Time to Resolve Ms])), 86400000) / 3600000)) & "H " & Text(Floor(Mod(Zn(Avg([Time to Resolve Ms])), 3600000) / 60000)) & "M " & Text(Floor(Mod(Zn(Avg([Time to Resolve Ms])), 60000) / 1000)) & "S" |
| CSAT | Avg CSAT Rating out of 5 | Sum([Csat]) / Sum([Count of Csat Timestamp]) |
| Users % By Country | Percentage of users located in different country | PercentOfTotal(Count([Profile Id])) |
| CSAT By Country | Average customer satisfaction rating segmented by the customer's geographic location. | Sum([Csat]) / Count([Csat Timestamp]) |
| CSAT By Platform | Average customer satisfaction rating broken down by the platforms. | Sum([Csat]) / Count([Csat Timestamp]) |
| CSAT By Language | Average customer satisfaction rating broken down by the customer's preferred language. | Sum([Csat]) / Count([Csat Timestamp]) |
| CSAT By App | Average customer satisfaction rating broken down by the apps. | Sum([Csat]) / Count([Csat Timestamp]) |
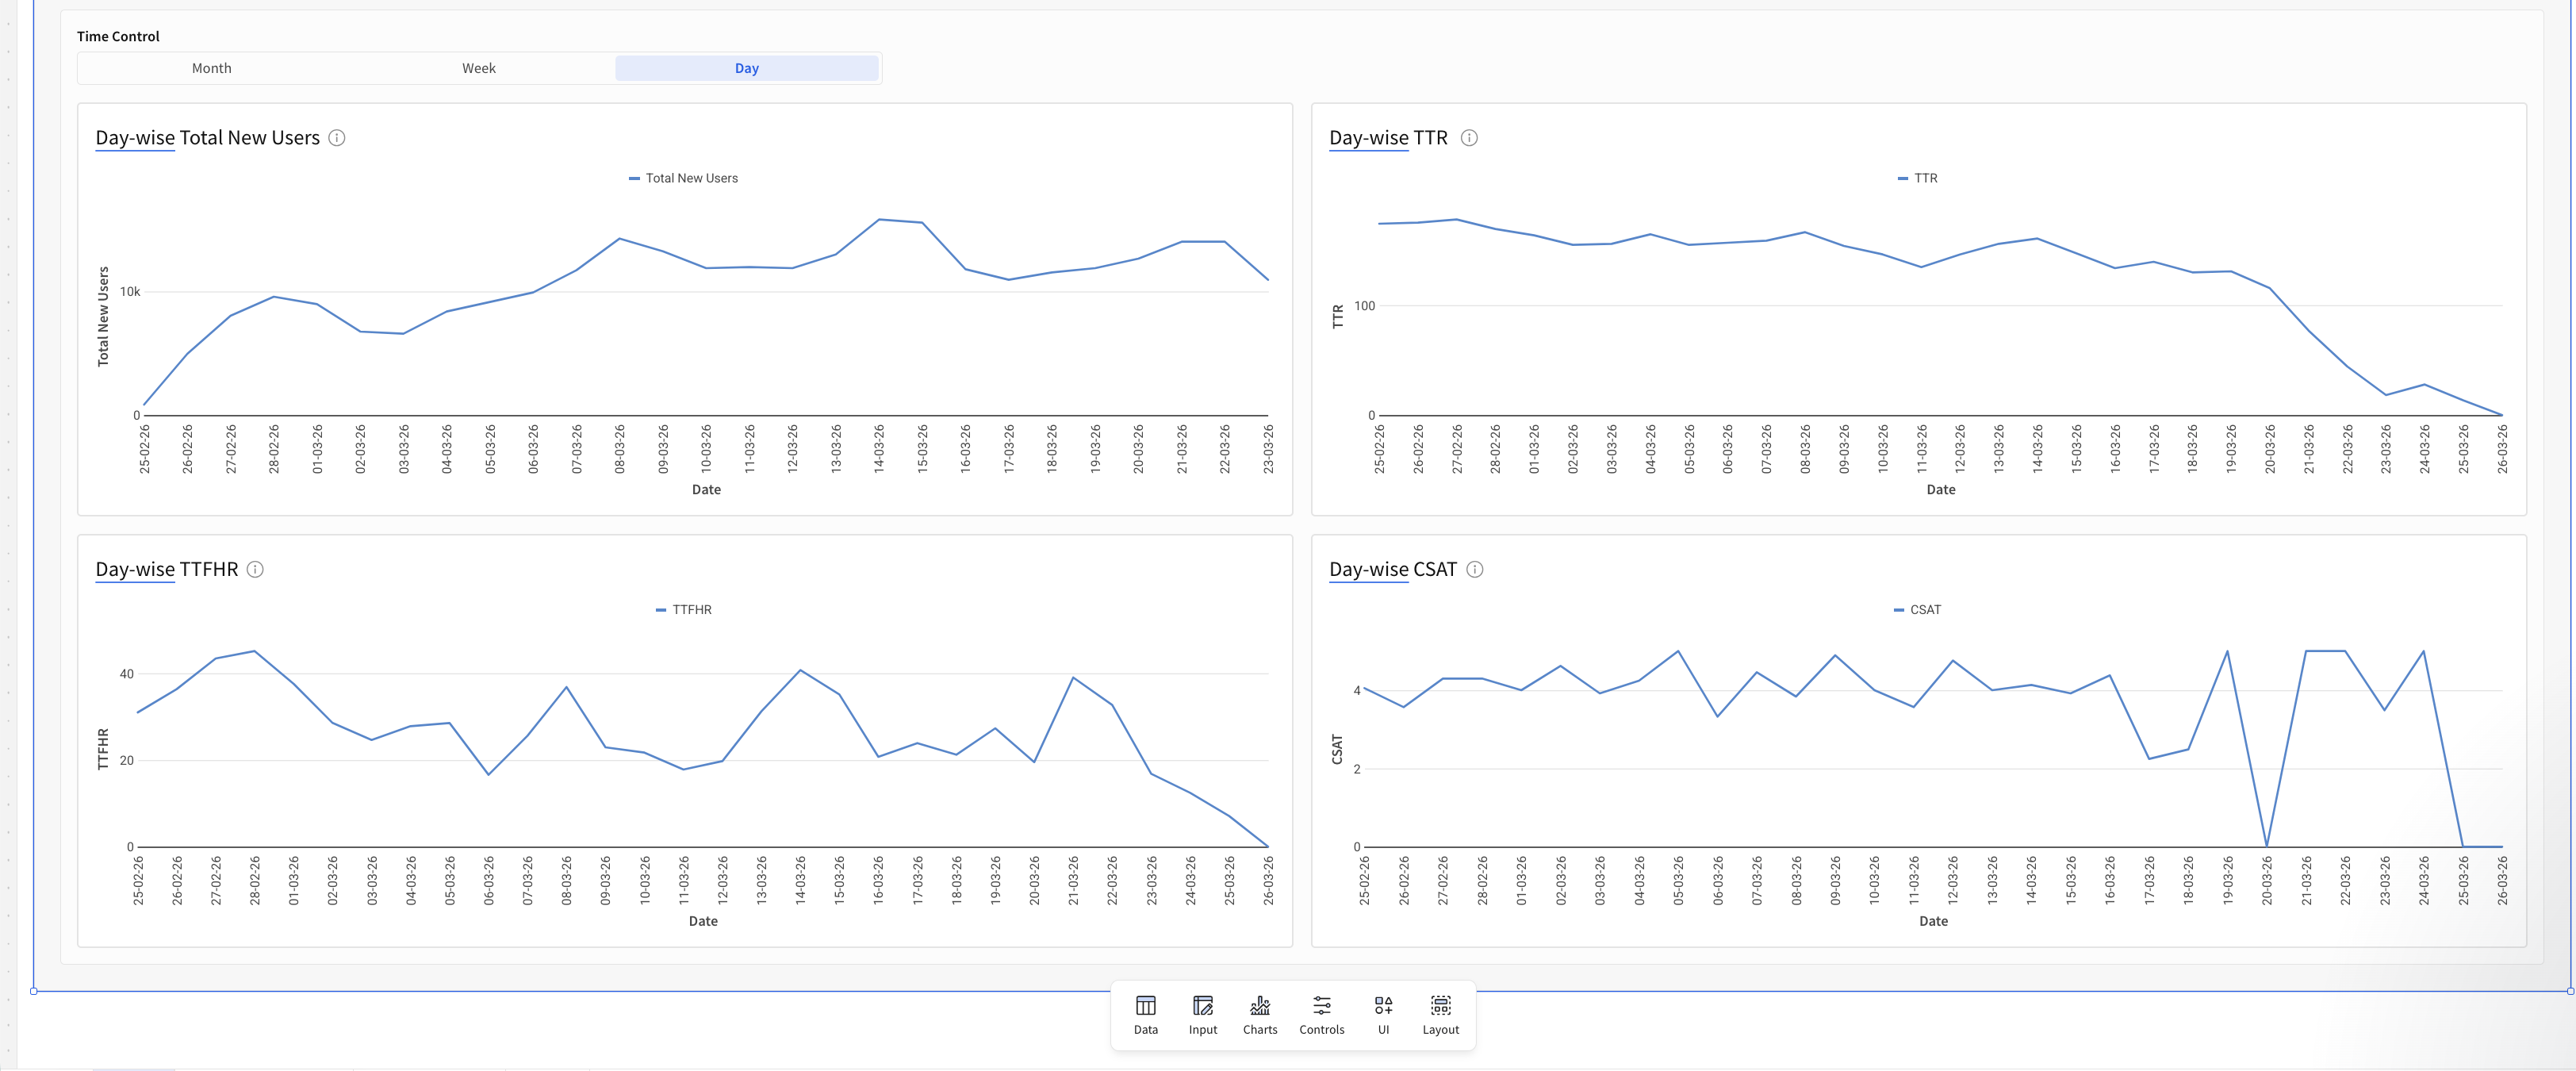
| Total New Users(Time wise) | Trend of total new users created rating over the selected period, shows growth rate. | Count([Profile Id]) |
| TTR(Time wise) | Trend of average time to Resolve (In Hrs) for support requests, showing speed of closure. | Avg([Time to Resolve Ms]) / 3600000 |
| TTFHR(Time Wise) | Trend of average time to First Human Response (In Hrs), tracking initial support | Avg([Time to First Human Resp Ms]) / 3600000 |
| CSAT(Time Wise) | Trend of average Customer Satisfaction (CSAT) rating over the selected period. | Sum([Csat (1)]) / Count([Csat Timestamp]) |
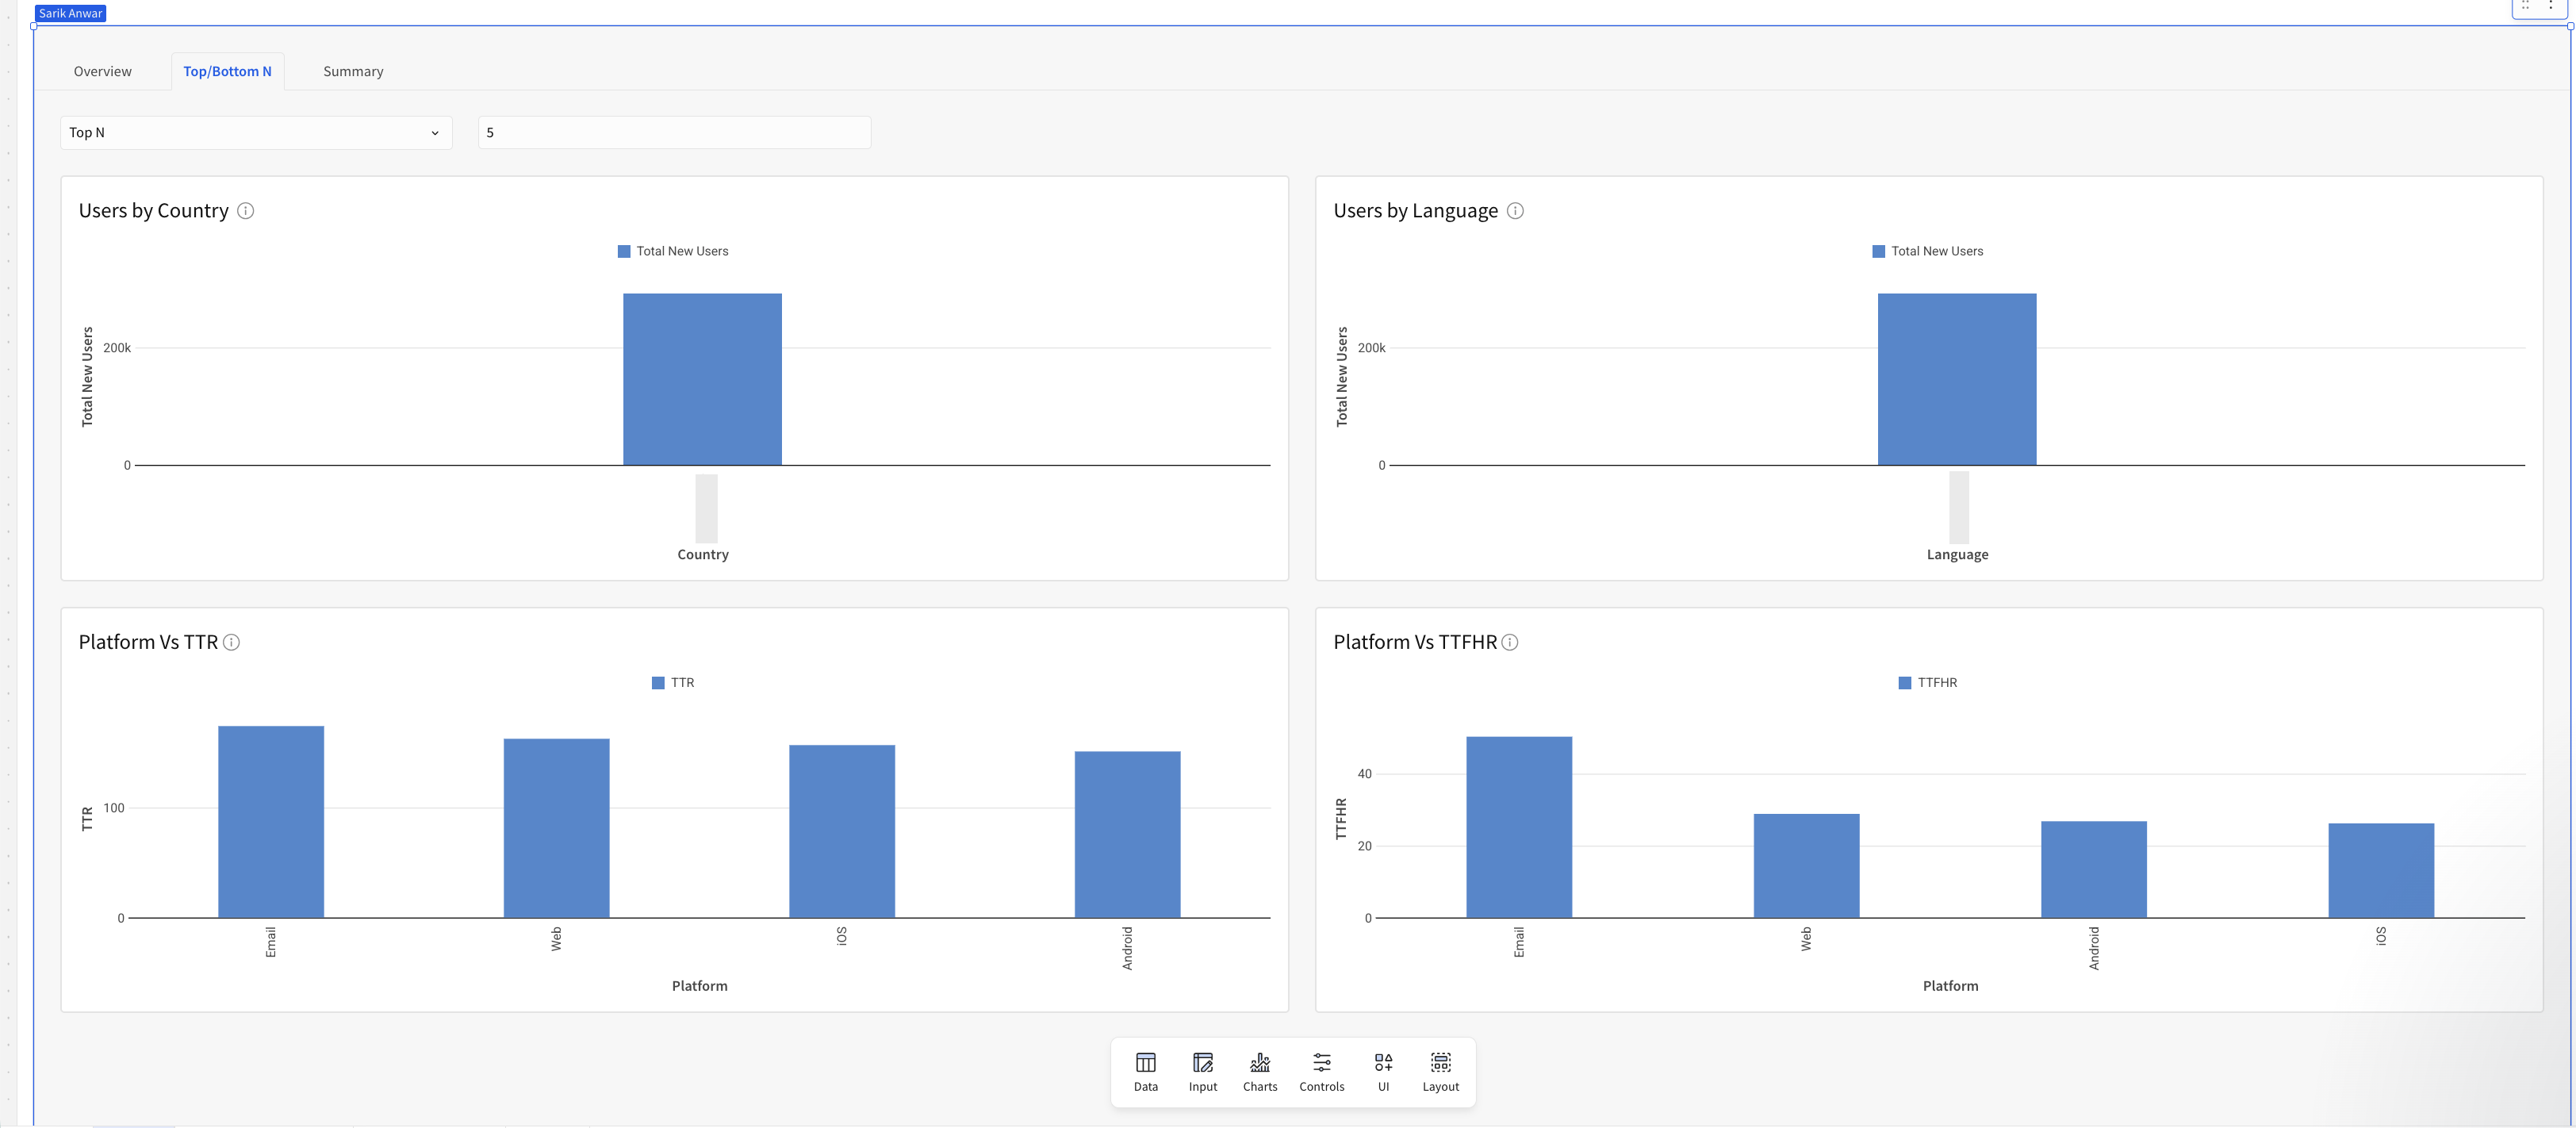
| Top/Bottom N - Users By Country | Geographical breakdown of user population by their registered country. | Count([Profile Id]) |
| Top/Bottom N - Users By Language | Analysis of the languages used by customer base. | Count([Profile Id]) |
| Top/Bottom N - Platform Vs TTR | Average Time to Resolve (In Hrs) for support requests, segmented by user platform. | Avg([Time to Resolve Ms]) / 3600000 |
| Top/Bottom N - Platform Vs TTFHR | Average Time to First Human Response (In Hrs), segmented by user platform. | Avg([Time to First Human Resp Ms]) / 3600000 |
| Summary Table | A consolidated view of all KPIs, grouped by date, to track performance trends and compare metrics across time periods at a glance. | All the calculations are same as KPI level calculation and Put all together in Tables as Summary |
Note: Metrics such as Active Users and Contact Rate rely on App Profile data. Please upgrade your SDK and integrate the new Identity Login API to enable App Profiles.
The Players template provides curated visualizations to help you quickly answer most of your insights. You can further customize these templates to fit your exact needs. Below is a breakdown of the available metrics.
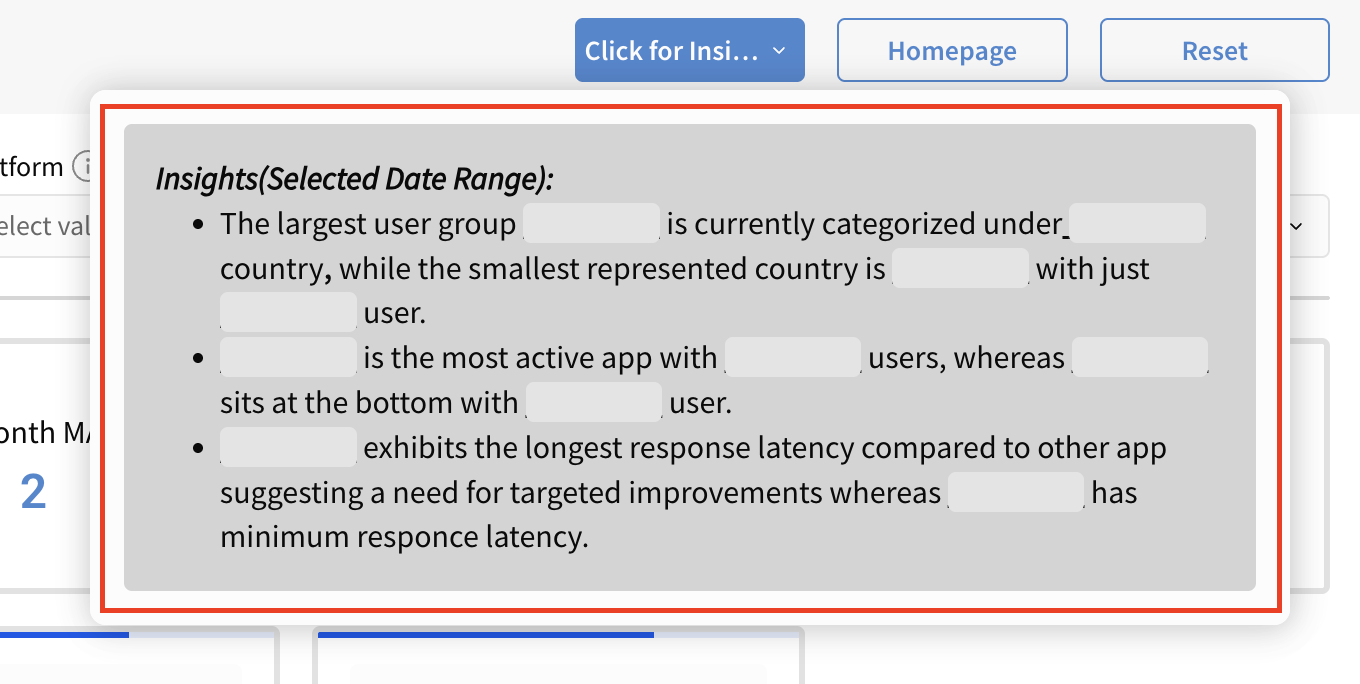
Pro Tip: Click the Click on Insight button to quickly view key insights from the report.
| Overview |
  |
| Top/Bottom N |
 |
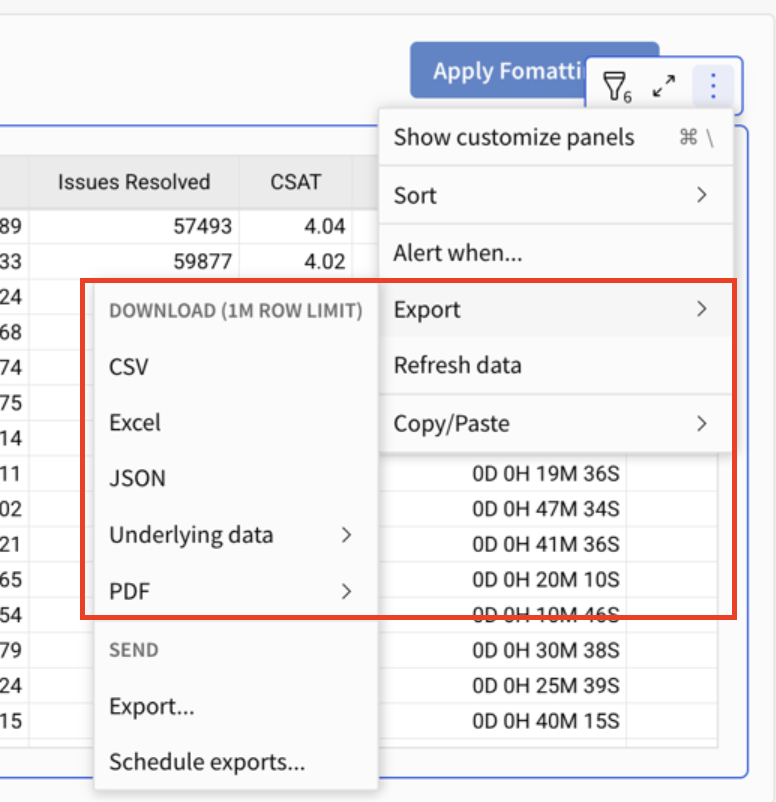
Summary Section
All the metrics mentioned above are also available in table format in the Summary Section. You can also download the data for every table in various formats by clicking on the Export option.
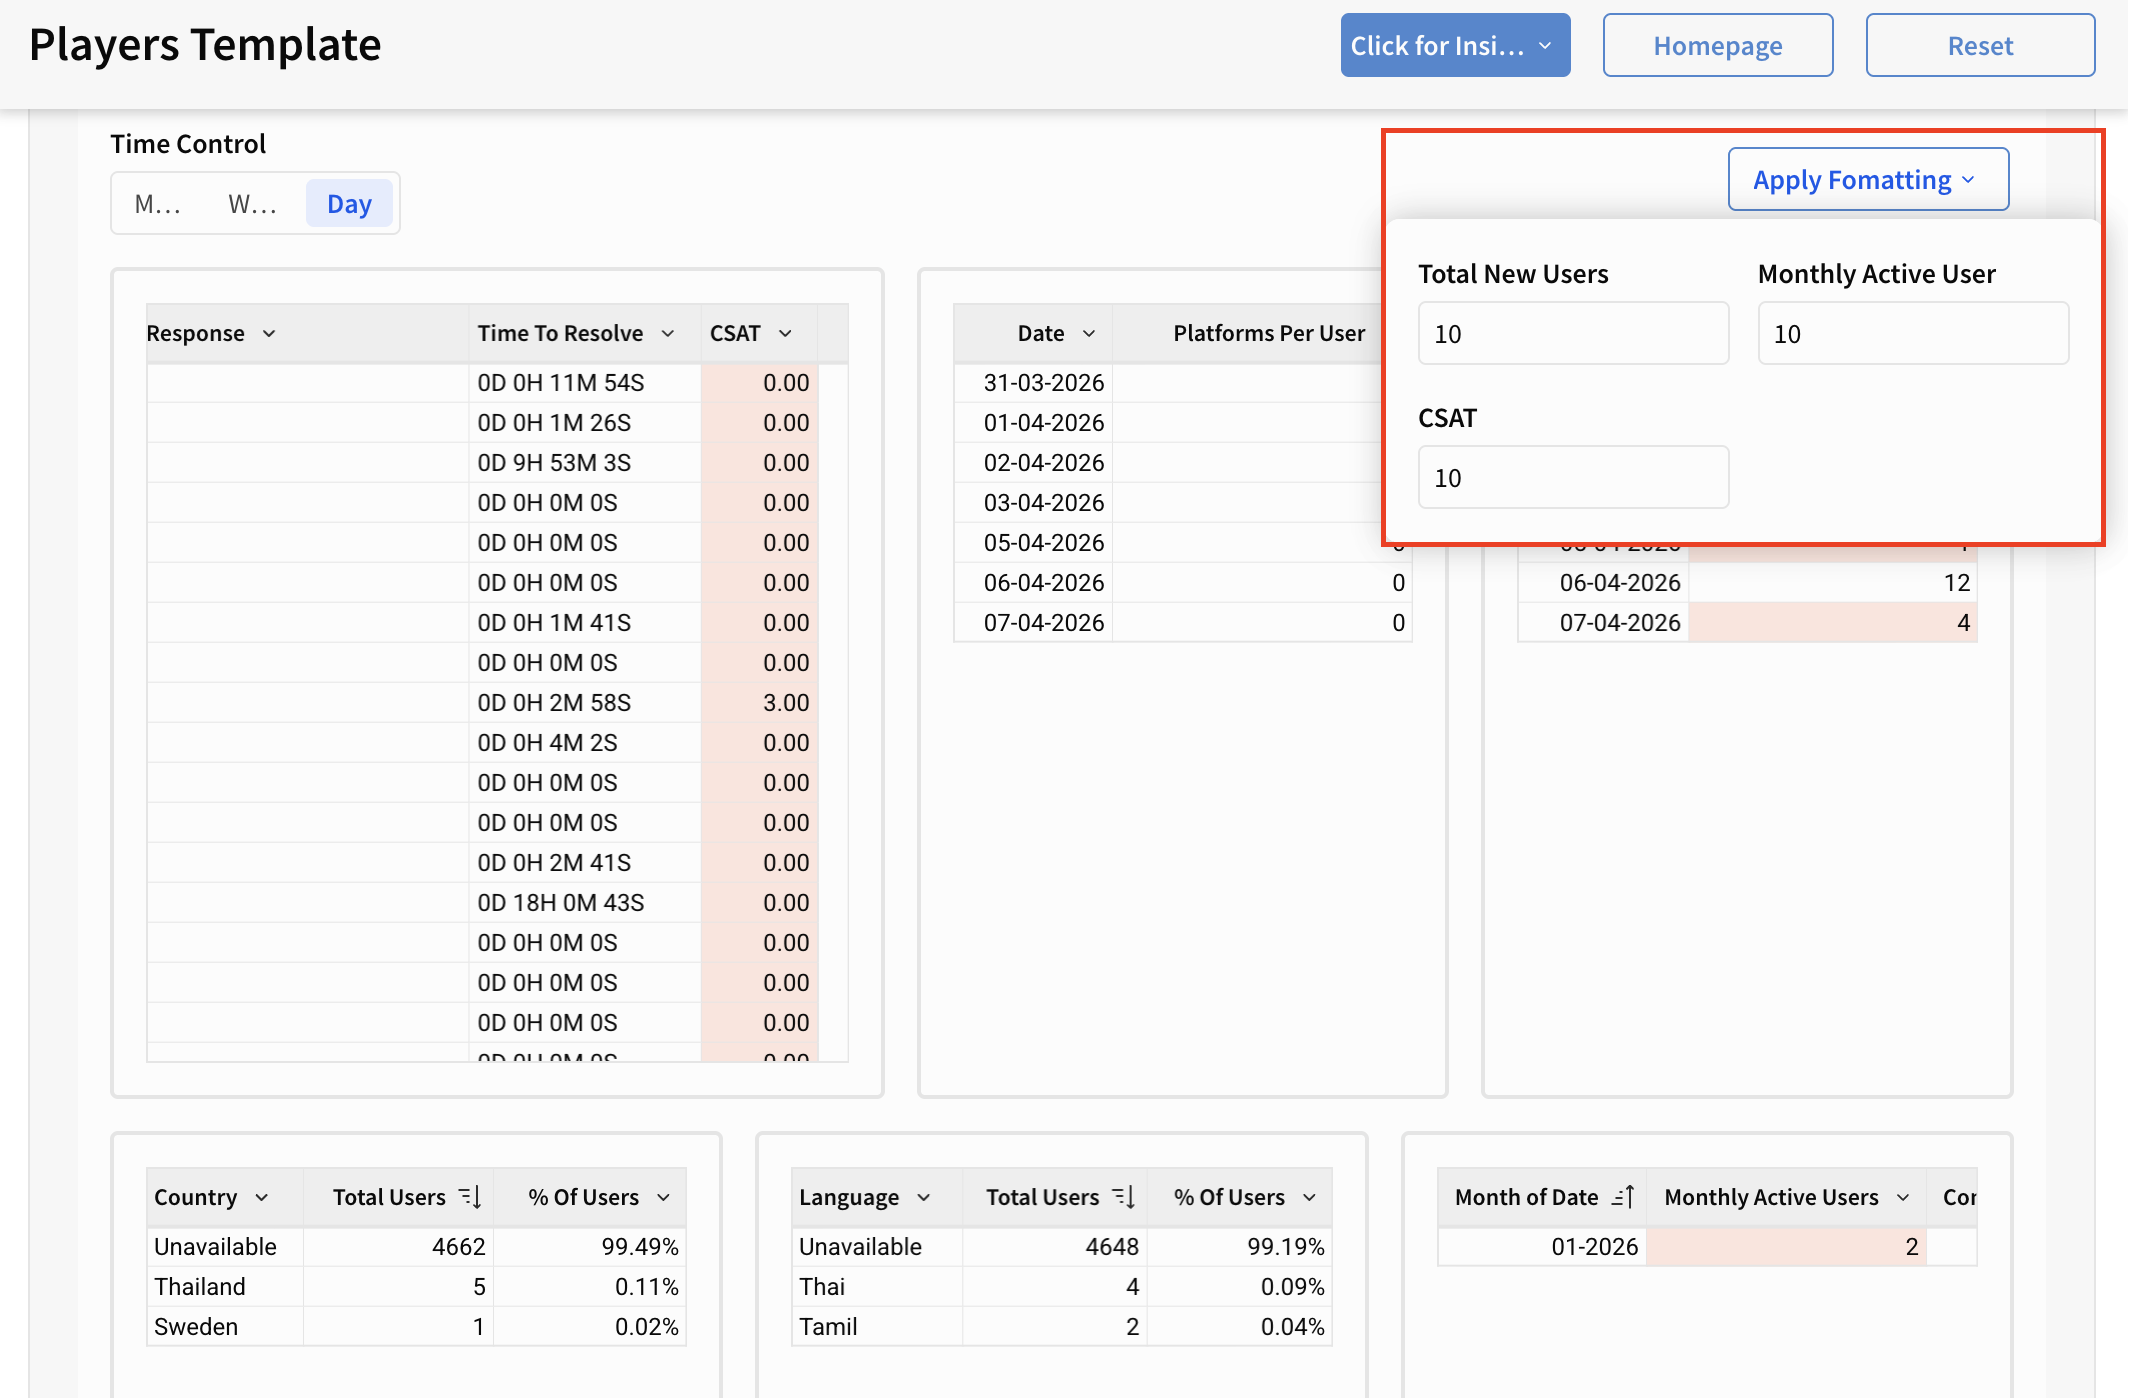
Pro Tip: Use Apply Formatting (top-right of the template) to instantly apply conditional formatting and highlight key metrics within the table. For example, you can set a rule to highlight values when CSAT is below 10, making it easier to spot trends and outliers at a glance.