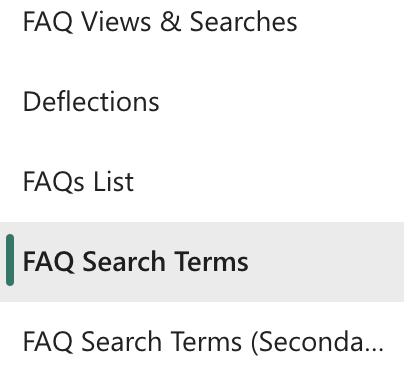
The FAQ Search Terms report can be found on the ‘FAQ Search Terms’ tab in the FAQ Analytics app.
This report provides the following metrics for evaluating the effectiveness of your FAQ searches:
- How many searches were done over the past 15 days?
- What were the most searched terms?
- How many searches failed to show any FAQ results?
The secondary report can be found on the tab to the right. This report provides tables of data and a word cloud related to FAQ searches that provided no results or no FAQs that users clicked into.
This provides your team with insights into what keywords you can provide matching results for, and helps you answer the following:
- What were the search terms that failed to show FAQ results?
- How many searches showed irrelevant results (where the user did not click anything after completing the search)?
- What were the search terms that showed irrelevant results?
Last but not least, the FAQs list provides a comprehensive list of detailed metrics for each of your FAQs.
You can use this report to:
- Review the overall performance of a specific FAQ by looking at the Views, Percentage of Likes, Successful & Failed Deflections metrics
- Sort FAQs by last updated date to identify FAQs that may need to be updated
To capture this data in a visual, you can create a custom report. To learn how, see How do I create a custom report in Power BI?
For a full review of what metrics are available in other reports and how to use them, please see our Power BI Reports Overview.


