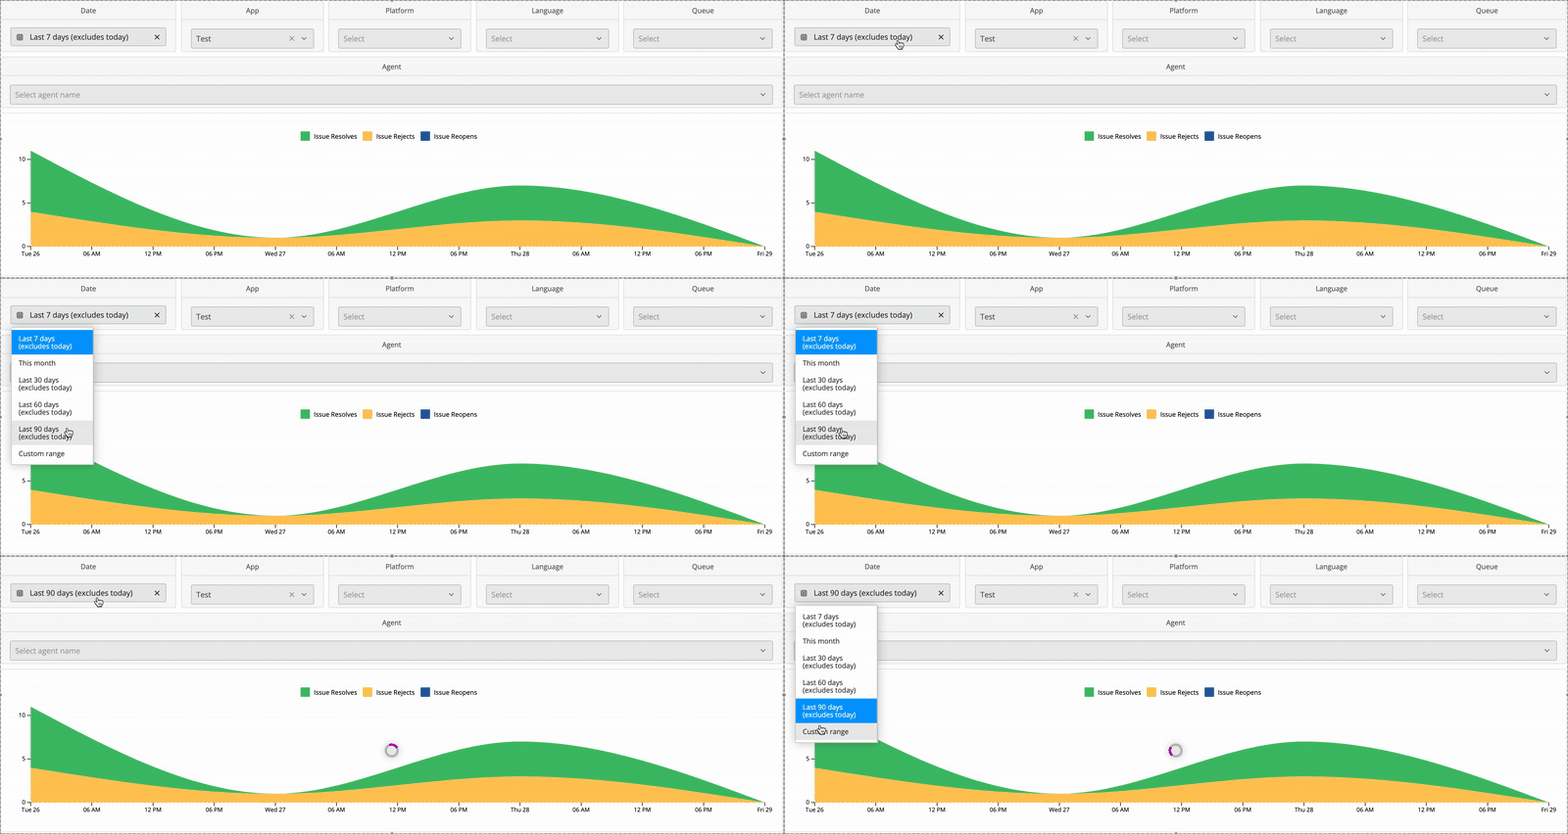
You can find information on Agent performance via the Analytics Dashboard by reviewing the tabs under ‘Teams’. There’s a wealth of information available in this area regarding your individual team members and Agent Groups.
In the Trends area, you can use the drop-downs at the top to review metrics by team members, apps, platforms, languages, dates, and more. The down arrow icon allows you to automatically download all of the metrics available for today.
Under the Summary by agents tab, you’ll see a list of all your Agents along with their Agent Score, Issue Assigns, Issue Resolves, CSAT, and much more. Scroll to the right to view the list and review additional metrics.
The following metrics (among others) are available in this area to evaluate an Agent’s performance:
- Agent Score: A scale of 1 to 10 based on the number of solutions accepted and rejected by the end user. A higher score essentially means more users were happier with your Agent’s responses.
- CSAT: The average CSAT response for the Agent. Agents should aim to have their CSAT responses as high as possible.
- Holding Time: Average time between an Issue getting assigned to an Agent and when the Agent replies. This excludes New Issue Automations.
- Time To First Response: Time taken by an Agent to first respond to an Issue. You want to keep this number as low as possible to provide the best support experience.
- Time To Resolve: Time taken to resolve an Issue. Your goal should be to have a short time to resolved coupled with a high average CSAT score or a high number of accepted solutions.
- FCR (first contact resolution) Rate: Percentage of cases resolved with a single outbound interaction. This should be reviewed against the Agent’s
- Acceptance Rate: A high number percentage for FCR isn’t ideal when combined with a low Acceptance Rate.
- Outbound Interactions: Number of outgoing messages from a given Agent. A low number means your Agents are effectively resolving Issues with very little back-and-forth communication.
The last tab, Summary by groups, allows you to review the same metrics for all Agent Groups you have created. If you’re not using Agent Groups, please see How do I create Agent Groups? to get started with this feature.
Groups are a great way to prioritize VIP or high paying users, urgent technical errors, and other types of Issues to receive faster support. Some metrics you should use when tracking high-priority groups are as follows:
- CSAT score: Your VIP Groups should have a high CSAT score.
- Time to First Response: Because you want to provide the best experience possible to VIP users, your Time to First Response should be shorter than for other Groups.
- Holding Time: Just like with Time to First Response, Holding Time should be lowered for your VIP Groups than for other Groups.

