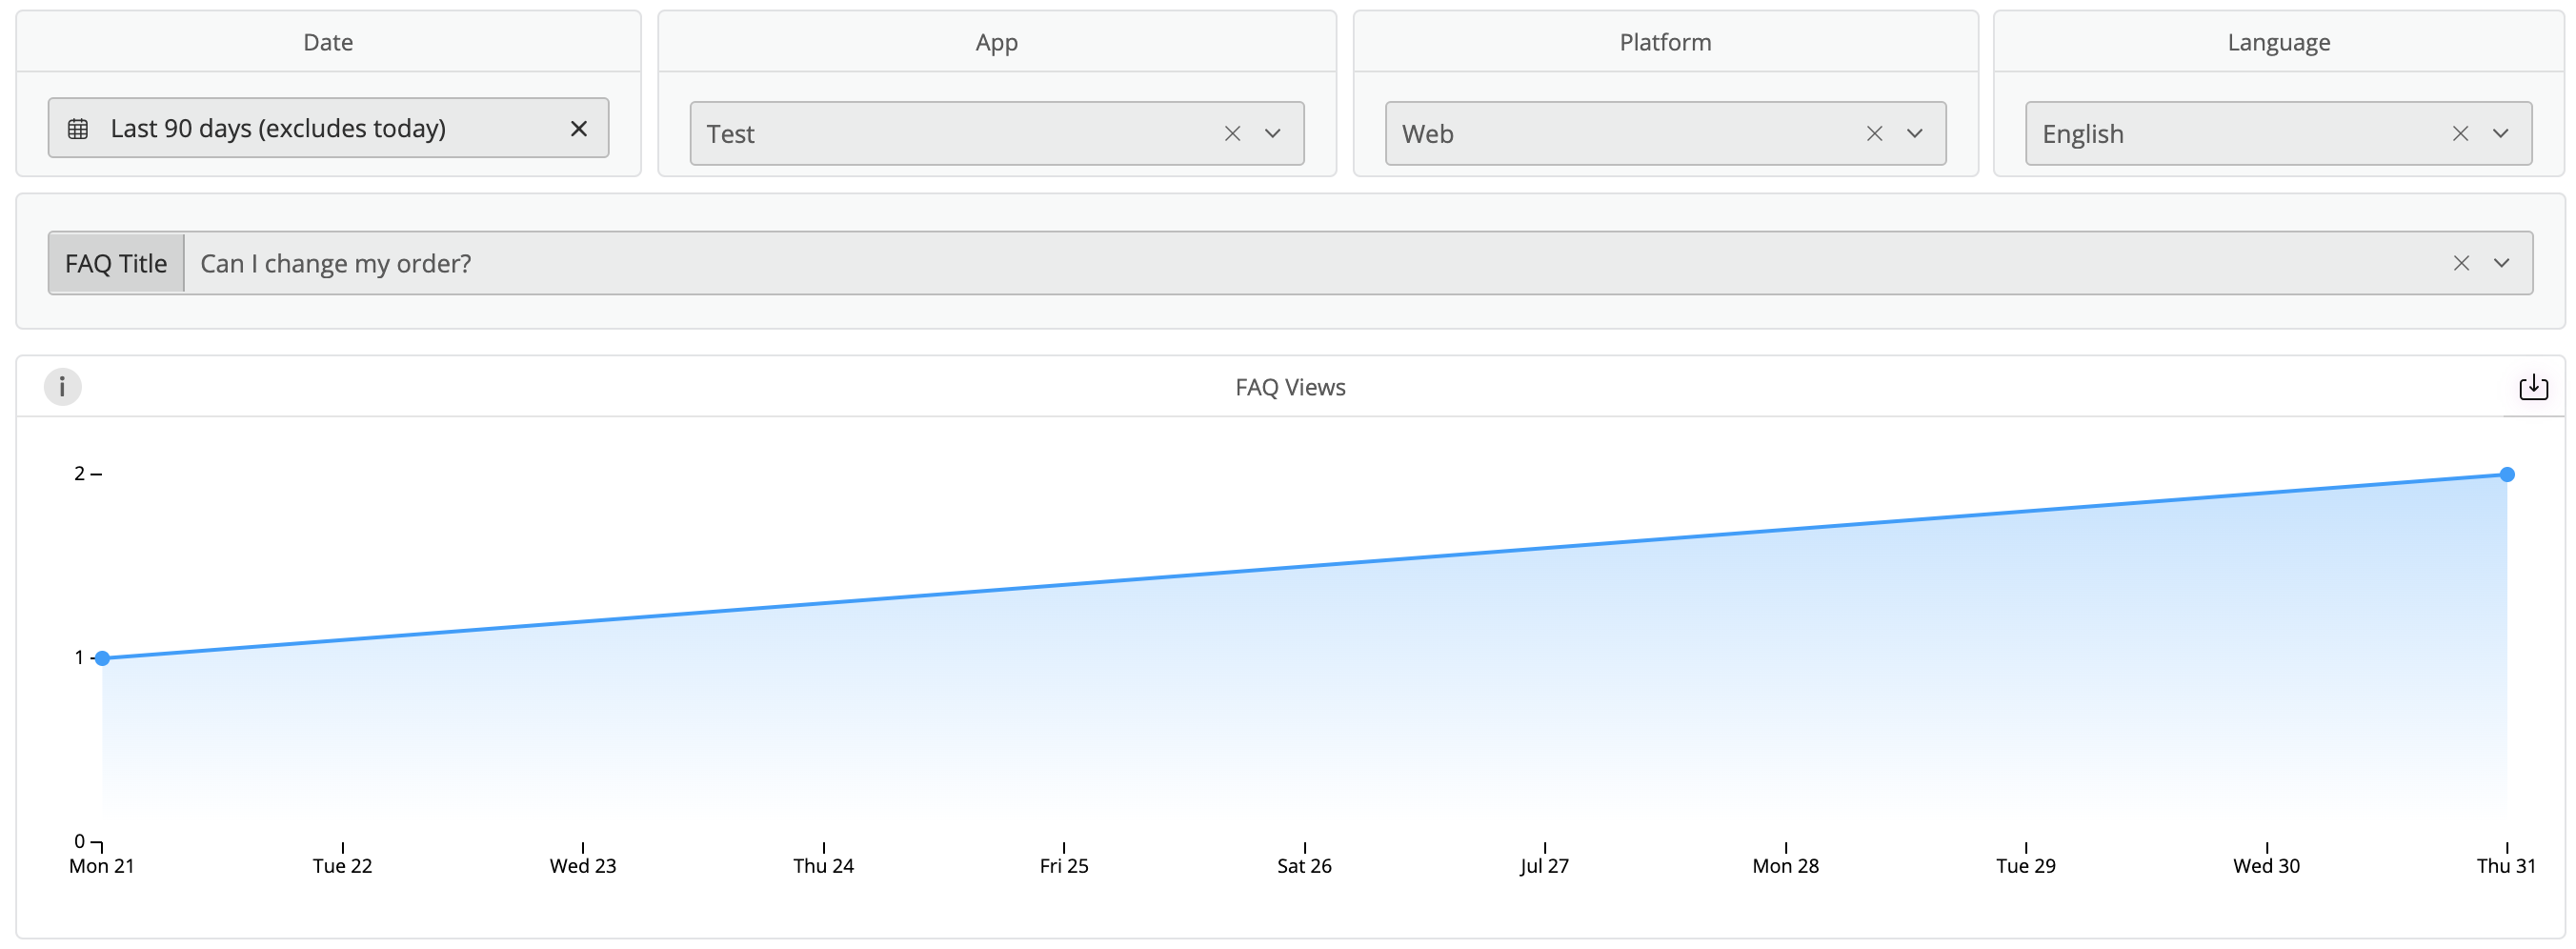
You can review information on FAQ effectiveness in your Helpshift Analytics Dashboard and in Power BI. To learn more about using Power BI to review FAQ metrics, see the FAQ Analytics section of the Power BI Reports Overview.
To track FAQ effectiveness in Helpshift Analytics, navigate to the tabs under ‘FAQ’. The data available here is divided into three categories: Trend, Summary by FAQ, and Summary by languages.
For each of the three tabs, you’ll need to select an FAQ article, app, platform, and date via the drop-downs at the top of the page to see data for that FAQ or language. If no data exists for the selected criteria, the page will display the message ‘No faq data for selected filters’.
Please note that all uses of Insert FAQ (even accidental or unsent ones) count towards the FAQ metrics. It does not filter based on sent or unsent status.
Click the link at the bottom to see a glossary for Analytics terms applicable to Helpshift. Click the down arrow icon to initiate a download of all relevant FAQ data.
You can measure FAQ effectiveness as follows:
- Compare your top tags (on the main page) to the FAQ content associated with those tags. Since these are the Issues that your users are writing into about the most, this is where you have the most potential to deflect Issues through self-service and FAQs.
- Review data for FAQs articles and FAQ Sections. Because these are the topics you are receiving the most number of Issues about, consider whether or not it’s worth creating a whole FAQ section around a particular article rather than a single FAQ.
To learn how to use Analytics data to evaluate Agent performance, see What metrics are available for evaluating Agent performance? To improve your FAQs, see How do I create FAQ Sections & articles? and What should I include in an FAQ article?

