The FAQs template provides a comprehensive overview of user interactions with FAQ content, tracking key metrics such as views, searches, likes, dislikes, and last updated timestamp.
Note: To learn how to access and use the FAQs template, refer to the Getting Started guide.
Exploring FAQs Template
Metrics in the FAQs template can be reviewed across various filters:
| Filter Name | Column | Applicable to Metrics |
| Date | UTC_TIME (For FAQ related) | ALL |
| App Name | APP_NAME | ALL |
| Platform | PLATFORM | ALL |
| Language | LANGUAGE | ALL |
| FAQ Title | FAQ_TITLE | Applicable to all except Issues and Search related metrics |
| Search Term | SEARCH_TERM | Only Applicable to Search related metrics |
Note: Use the Time Control at the bottom of the overview section to dynamically update all charts and tables below. You can adjust the data display by:
Day: Track short-term fluctuations and daily performance.
Week: Highlight weekly patterns (starts on Sunday).
Month: View a high-level summary (starts on the 1st).
This flexibility enables you to quickly switch between insights, making it easier to identify trends over time.
Detailed information on each metric is given below:
| Metric Name | Description | Calculations |
| FAQ Searches | Number of times FAQ are being searched | Sum ([Total Search Count]) |
| Successful Search | FAQ searches which turned up FAQs where the user clicked on one or more of the FAQs that appeared. | Sum([Successful Search Result Count]) |
| FAQ Views | Number of times FAQ Views | Sum ([Faq View Count]) |
| Successful Deflection | Count of FAQ views that did not result in an issue within 15 minutes (or led to an issue after 15 minutes). | Sum([Successful Faq Deflection Count]) |
| Failed Deflection | Count of FAQ views that resulted in an issue being created within 15 minutes. | Sum([Failed Faq Deflection Count]) |
| Issues Created | No. of Issues being Created in Selected time period | Count (Created_Timestamp) |
| FAQ Searches Over Time | Shows volume of total search count, successful searches, FAQ searches with no result and no click over time | otal Search= Sum ([Total Search Count]) Successful Search= Sum([Successful Search Result Count]) No Result FAQ= Sum([No Faq Result Count]) No Click FAQ= Sum([No Faq Result Count]) |
| Top 10 Search Term | Shows the top 10 search terms based on count, categorized as Successful Searches, Searches with No Results, and Searches with No Clicks. | Search Count= Switch([Search-Control], "With No Result", Sum([No Faq Result Count]), "Successful Search", Sum([Successful Search Result Count]), "With No Click", Sum([No Faq Click Count])) |
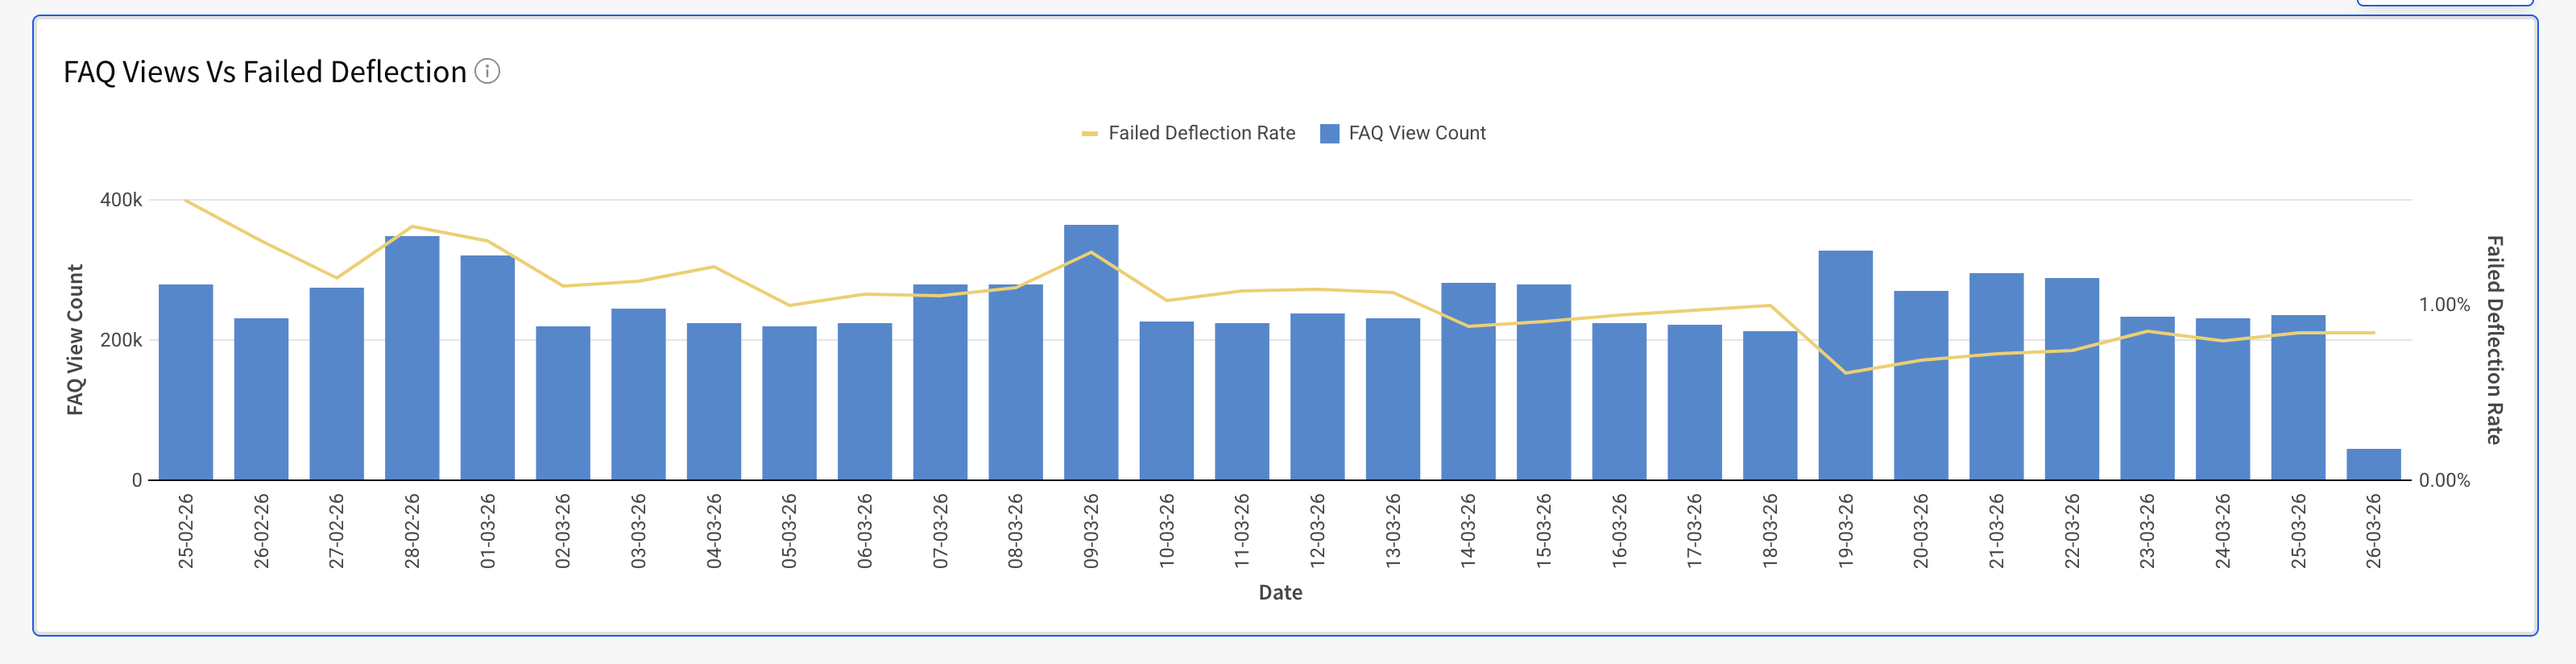
| FAQ Views Vs Failed Deflection Rate | Shows visual comparison of how often users are accessing the FAQ content versus how often it fails to resolve their queries. | FAQ Views= Sum([Faq View Count]) Failed Deflection Rate= Sum([Failed Faq Deflection Count])/(Sum([Failed Faq Deflection Count])+Sum([Successful Faq Deflection Count])) |
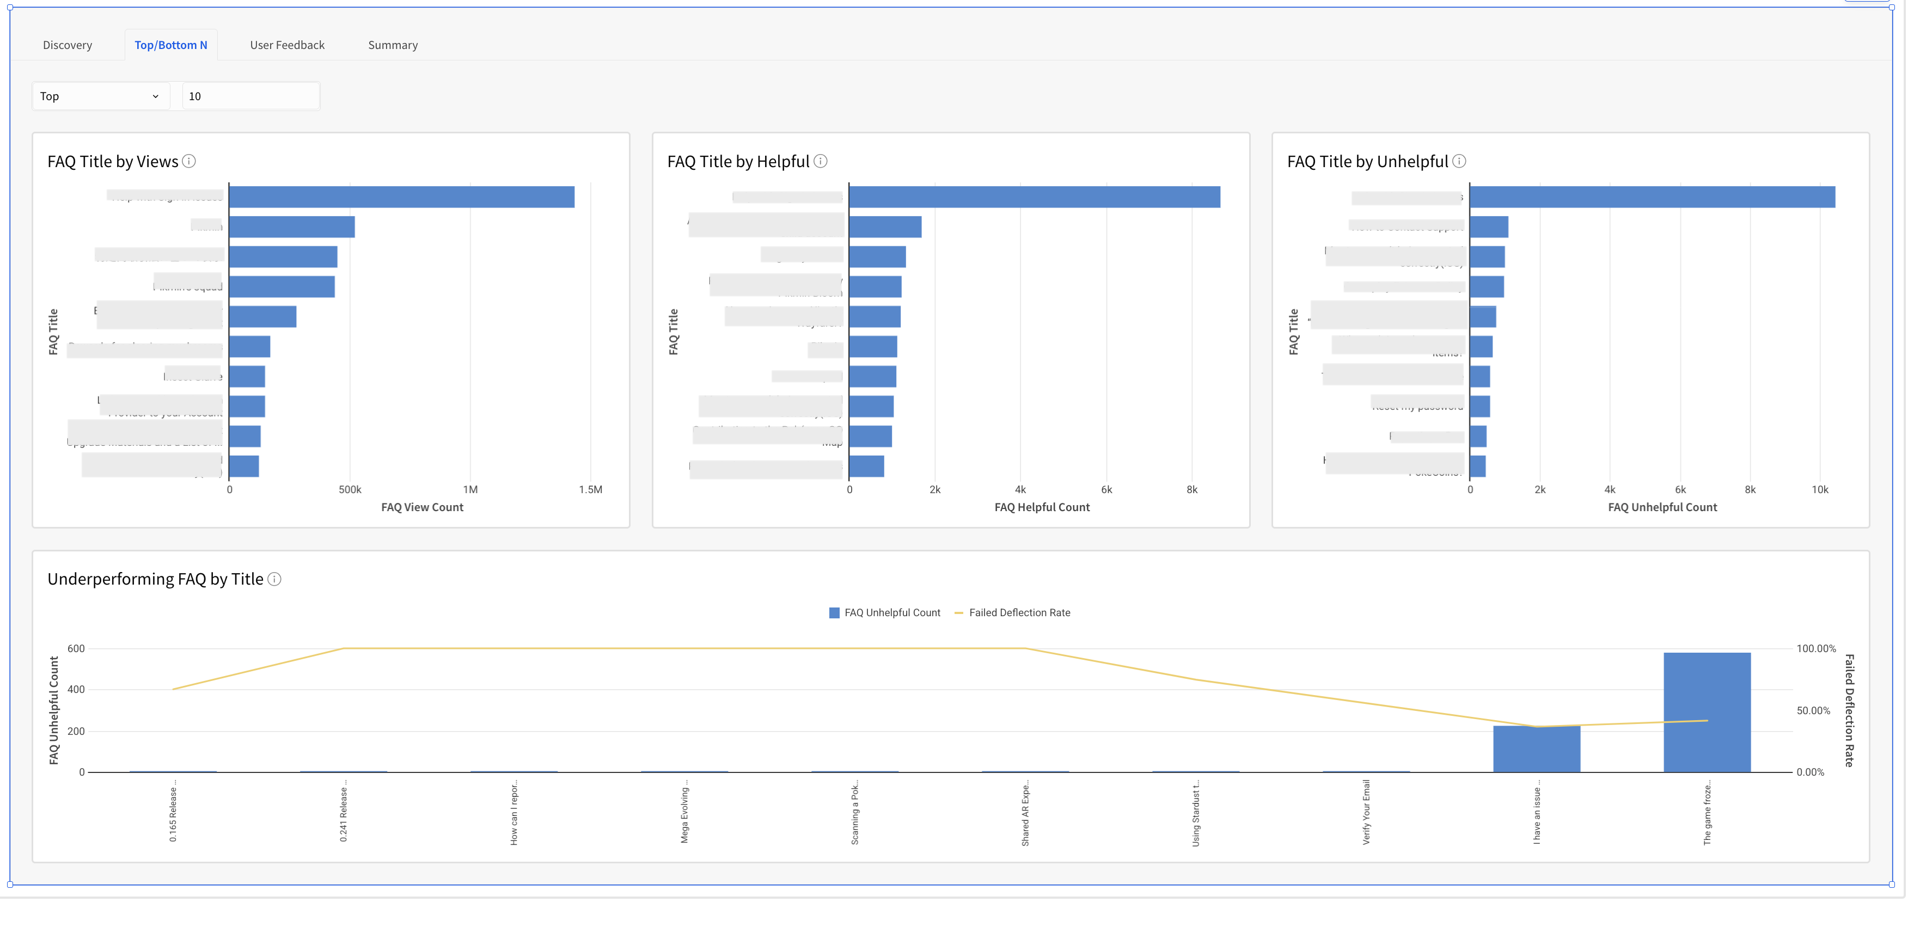
| Top/Bottom N FAQ Title by Views | Shows the top and bottom N FAQ Title, helping identify which articles are most frequently viewed and which ones require rework. | FAQ View= Sum([Faq View Count]) |
| Top/Bottom N FAQ Title by Helpful | Shows the top and bottom N FAQ Title, helping identify which articles received the most likes and the least likes from users. | FAQ Helpful= Sum([Faq Helpful Count]) |
| Top/Bottom N FAQ Title by Unhelpful | Shows the top and bottom N FAQ Title, helping identify which articles received the most likes and the least dislikes from users. | FAQ Unhelpful= Sum([Faq Unhelpful Count]) |
| Underperforming FAQ by Title | Shows the top and bottom N FAQ titles, tracking FAQs that drive poor user experience based on unhelpful counts and failed deflection rates over time. | FAQ Unhelpful= Sum([Faq Unhelpful Count]) Failed Deflection Rate= Sum([Failed Faq Deflection Count])/(Sum([Failed Faq Deflection Count])+Sum([Successful Faq Deflection Count])) |
| Helpful Vs Unhelpful FAQs | Shows Helpful and Unhelpful Counts on FAQ over time | FAQ Helpful= Sum([Faq Helpful Count]) FAQ Unhelpful= Sum([Faq Unhelpful Count]) |
| FAQs Deflection wise | Shows Successful and Failed Deflection Counts on FAQ over time | Successful Deflection= Sum([Successful Faq Deflection Count]) Failed Deflection=Sum([Failed Faq Deflection Count]) |
| FAQ Audit Performance | Overview of each FAQ title displaying its last updated timestamp, total likes and dislikes received, and its successful deflection rate. | Successful Deflection Rate= Sum([Successful Faq Deflection Count])/(Sum([Failed Faq Deflection Count])+Sum([Successful Faq Deflection Count])) |
| Summary Table | A consolidated view of all metrics, grouped by date, to track performance trends and compare metrics across time periods at a glance. | All the calculations are same as metric level calculation and Put all together in Tables as Summary |
Note: Metrics such as Active Users and Contact Rate rely on App Profile data. Please upgrade your SDK and integrate the new Identity Login API to enable App Profiles.
The FAQs template provides curated visualizations to help you quickly answer most of your insights. You can further customize these templates to fit your exact needs. Below is a breakdown of the available metrics.
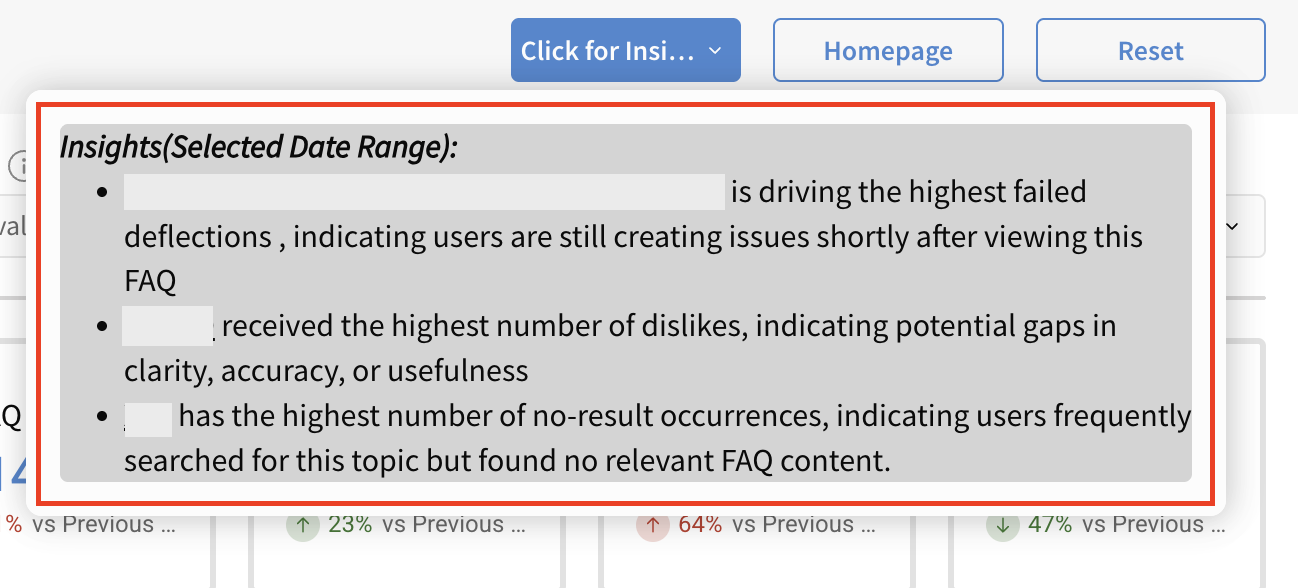
Pro tip: Click the Click on Insight button to quickly view key insights from the report.
| Discovery |
  |
| Top/Bottom N |
 |
| User Feedback |
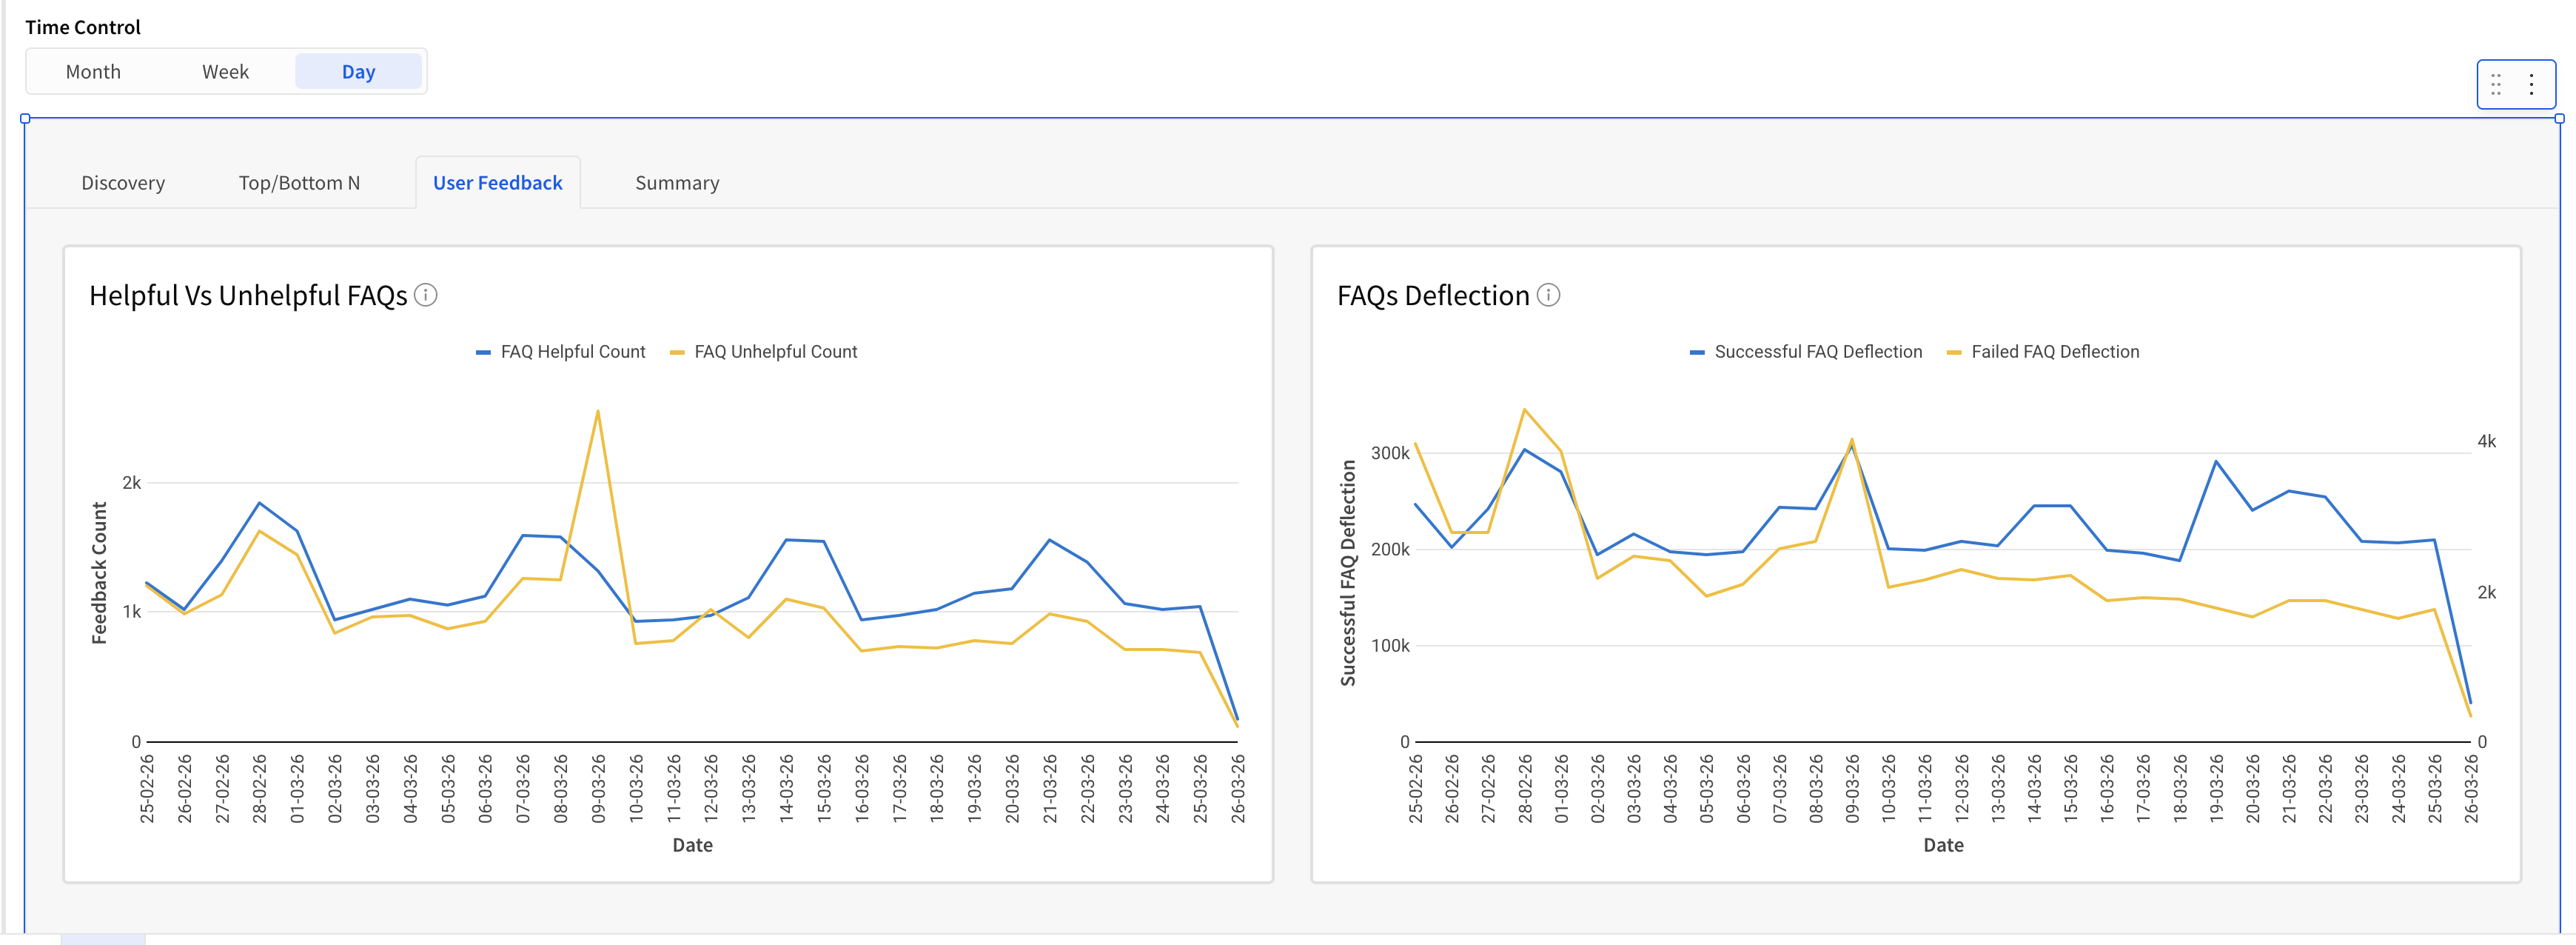 |
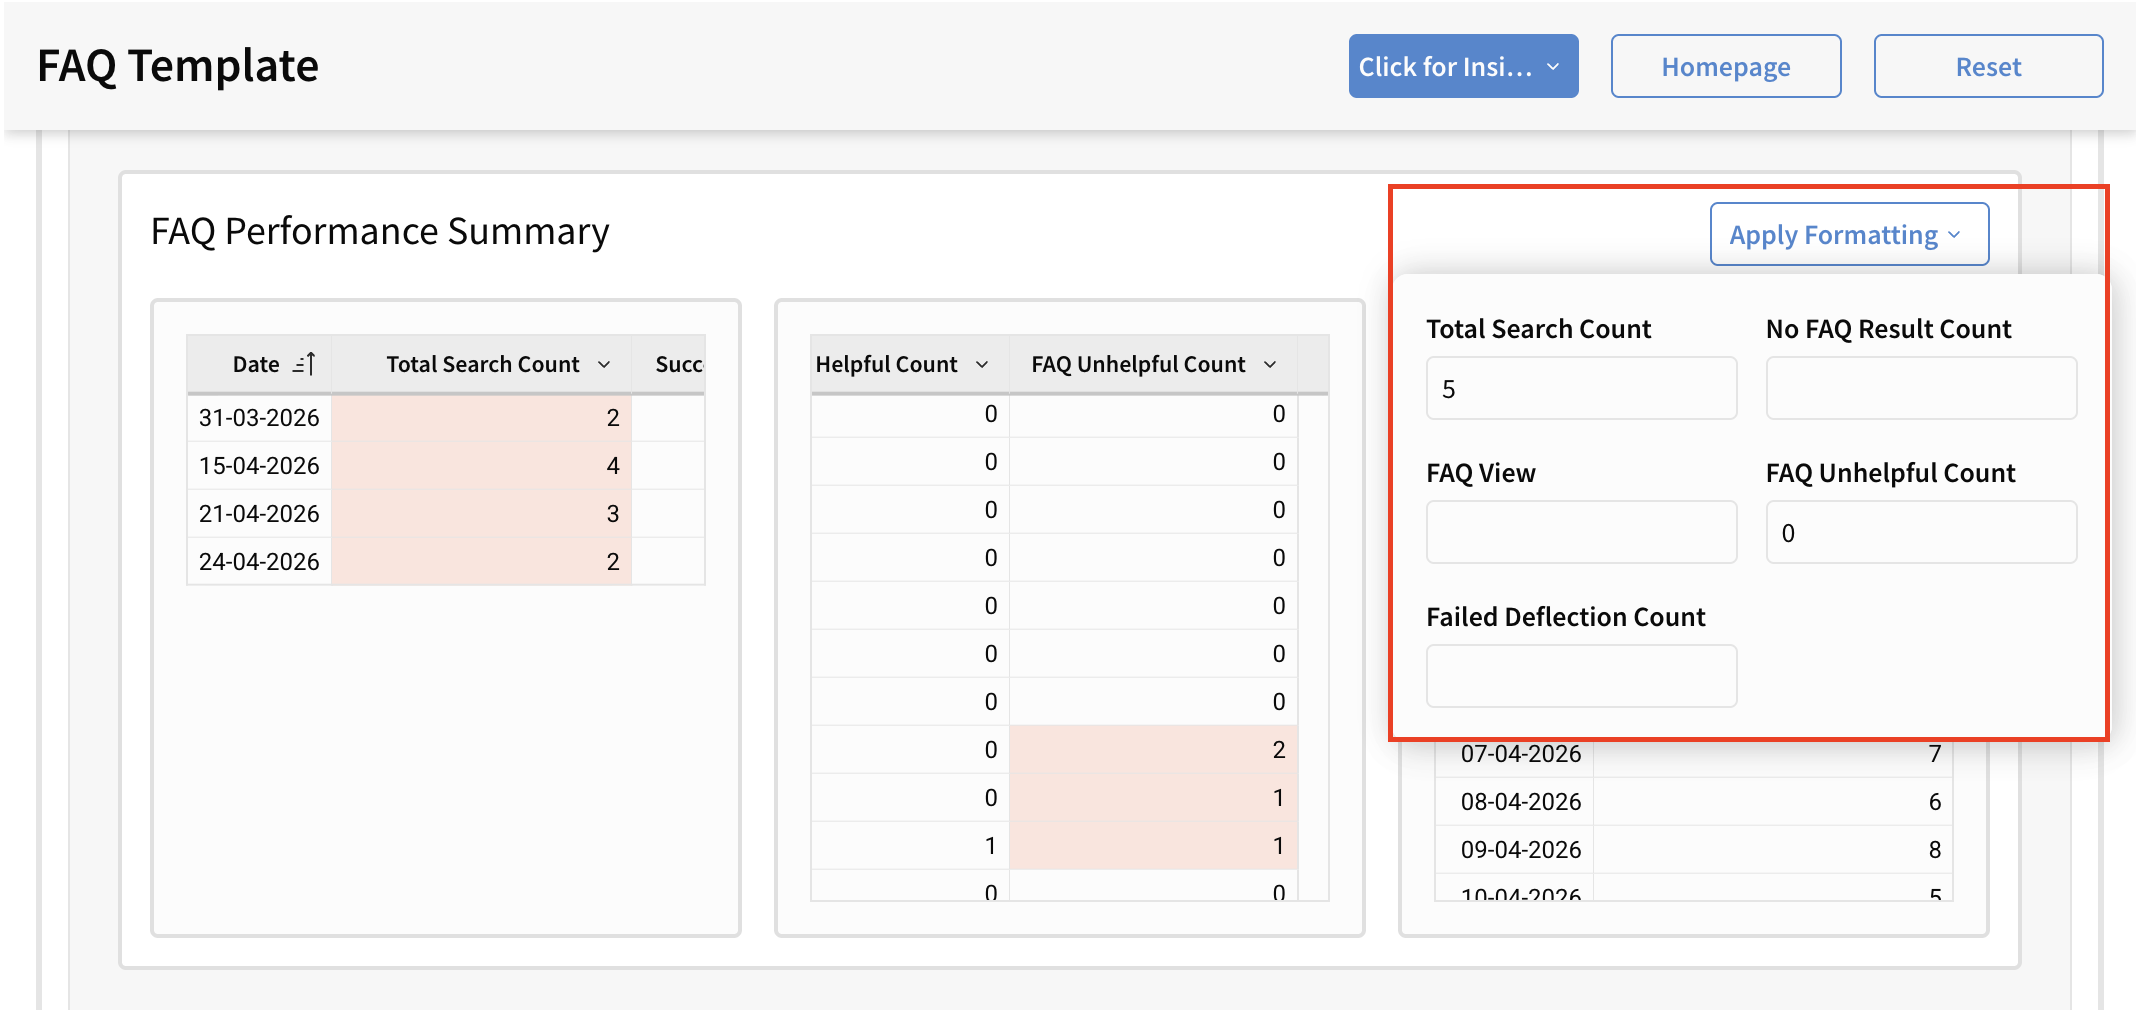
Summary Section
All the metrics mentioned above are also available in table format in the Summary Section. You can also download the data for every table in various formats by clicking on the Export option.
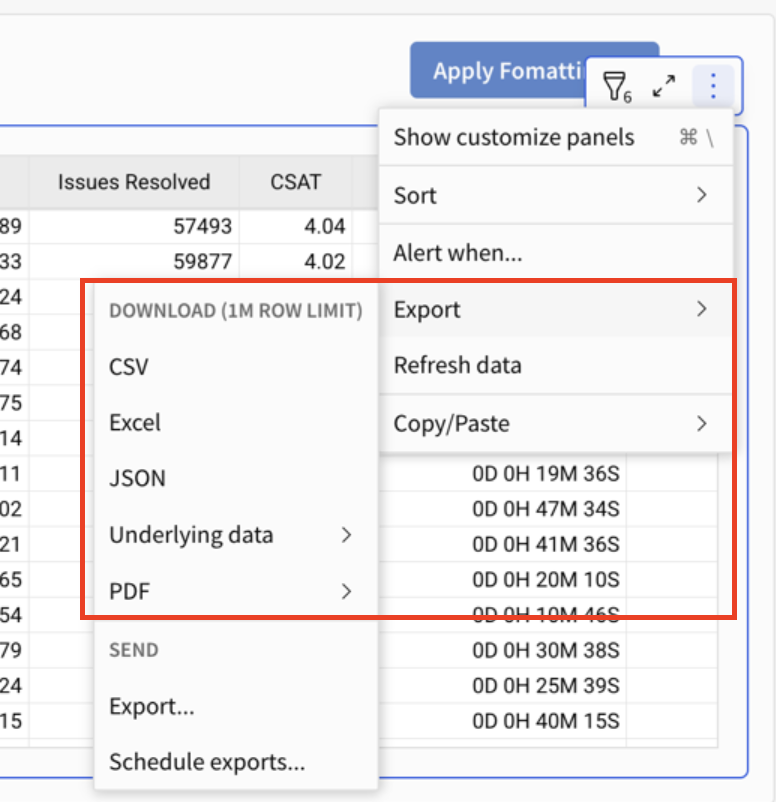
Pro tip: Use Apply Formatting (top-right of the template) to instantly apply conditional formatting and highlight key metrics within the table. For example, you can set a rule to highlight values when the Total Search count is below 5, making it easier to spot trends and outliers at a glance.