The Apps template provides a comprehensive view of your app’s performance by tracking user growth, engagement, platform usage, and issue trends.
Note: To learn how to access and use the Apps template, refer to the Getting Started guide.
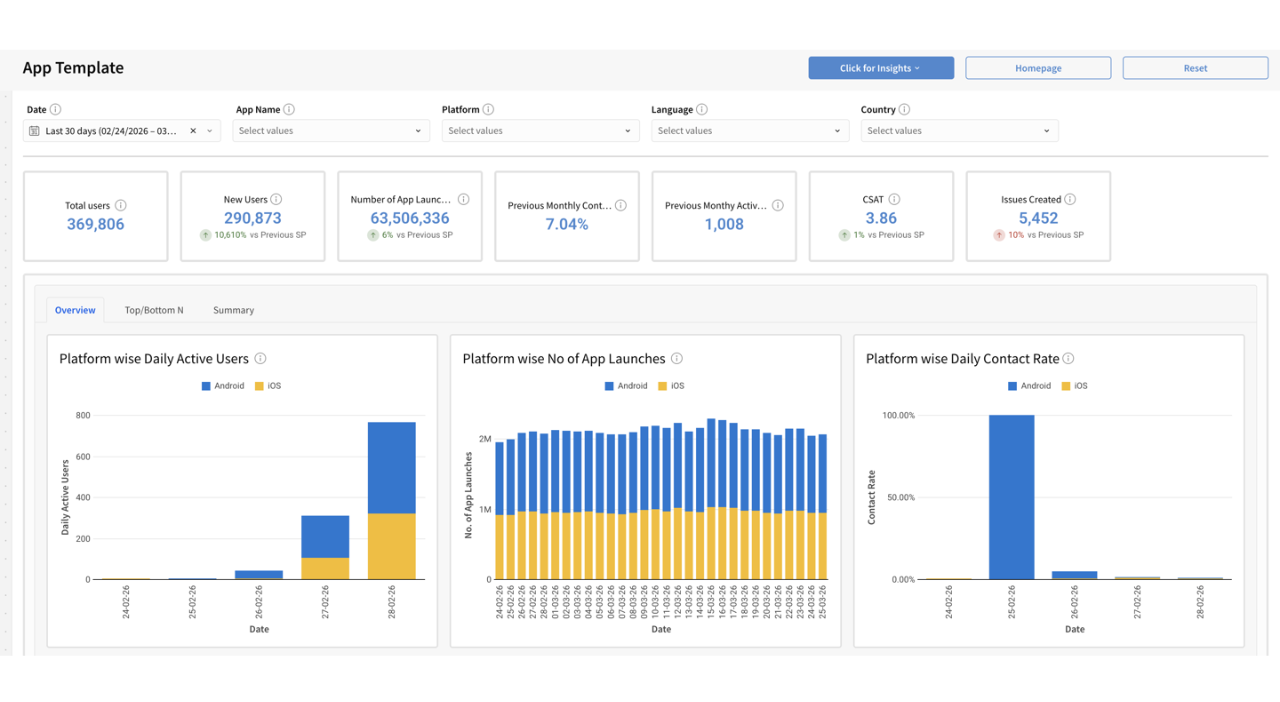
Exploring Apps Template
Metrics in the Apps template can be reviewed across various filters:
| Filter Name | Column | Applicable to Metrics |
| Date | CREATED_TIMESTAMP | ALL |
| App Name | APP NAME | ALL |
| Platform | PLATFORM | Applicable to all except metrics- total user and new users |
| Language | LANGUAGE | Applicable to all except metrics- total user, new users |
| Country | COUNTRY | Applicable to all except metrics- total user and new users, total issues and issues created |
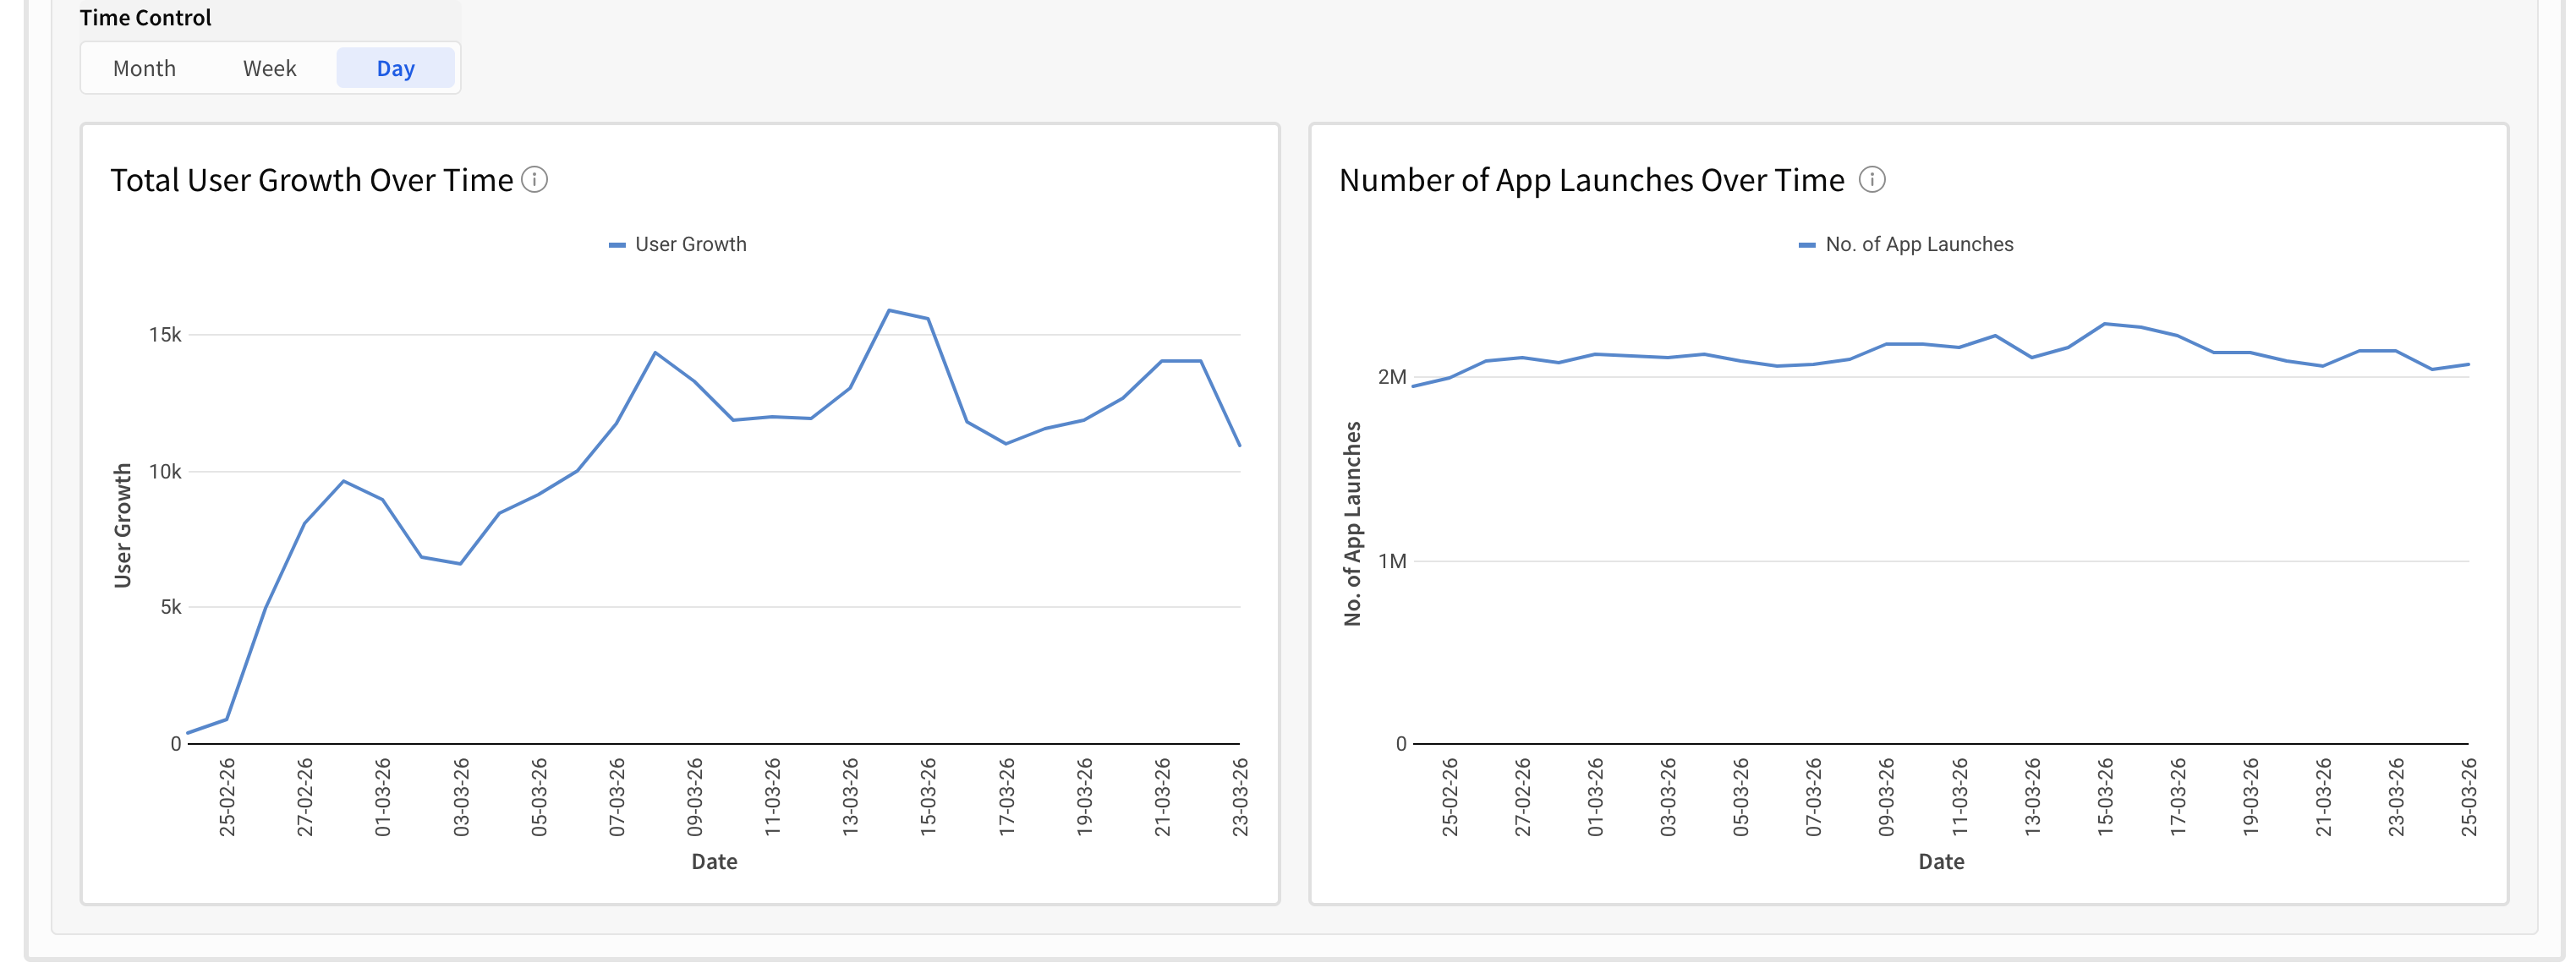
Note: Use the Time Control at the bottom of the overview section to dynamically update all charts and tables below. You can adjust the data display by:
Day: Track short-term fluctuations and daily performance.
Week: Highlight weekly patterns (starts on Sunday).
Month: View a high-level summary (starts on the 1st).
This flexibility enables you to quickly switch between insights, making it easier to identify trends over time.
Detailed information on each metric is given below:
| Metric | What does it measure? | How do we calculate it? |
| Total users | Total number of unique users who interacted with the app | CountDistinct([Profile Id]) |
| New Users | Number of users who joined the app within the selected time period | CountDistinct([Profile Id]) |
| Number of App Launches | Total number of times the app was launched by users | Sum([Widget Load Count]) |
| Previous Monthly Contact Rate | Ratio of issues created to active users in the previous month, indicating user support demand | SUM([M_ISSUE_CREATED_COUNT]) / SUM([UNIQUE_USER_COUNT]) |
| Previous Monthly Active Users | Total number of unique users who were active in the previous month | SUM([Unique Users Count]) |
| CSAT | Average customer satisfaction score based on user feedback ratings | Sum([Csat Sum]) / Sum([Csat Count]) |
| Issues Created | Total number of issues created within the selected time period | Sum([Issues Created Count]) |
| Platform-wise Daily Active Users | Shows the number of unique active users across platforms on a daily basis | SUM(UNIQUE_USER_COUNT) |
| Platform-wise Number of App Launches | Shows total app launches segmented by platform | SUM(WIDGET_LOAD_COUNT) |
| Platform-wise Daily Contact Rate | Shows the ratio of issues created to active users across platforms on a daily basis | SUM(ISSUES_CREATED_COUNT) / SUM(UNIQUE_USER_COUNT) |
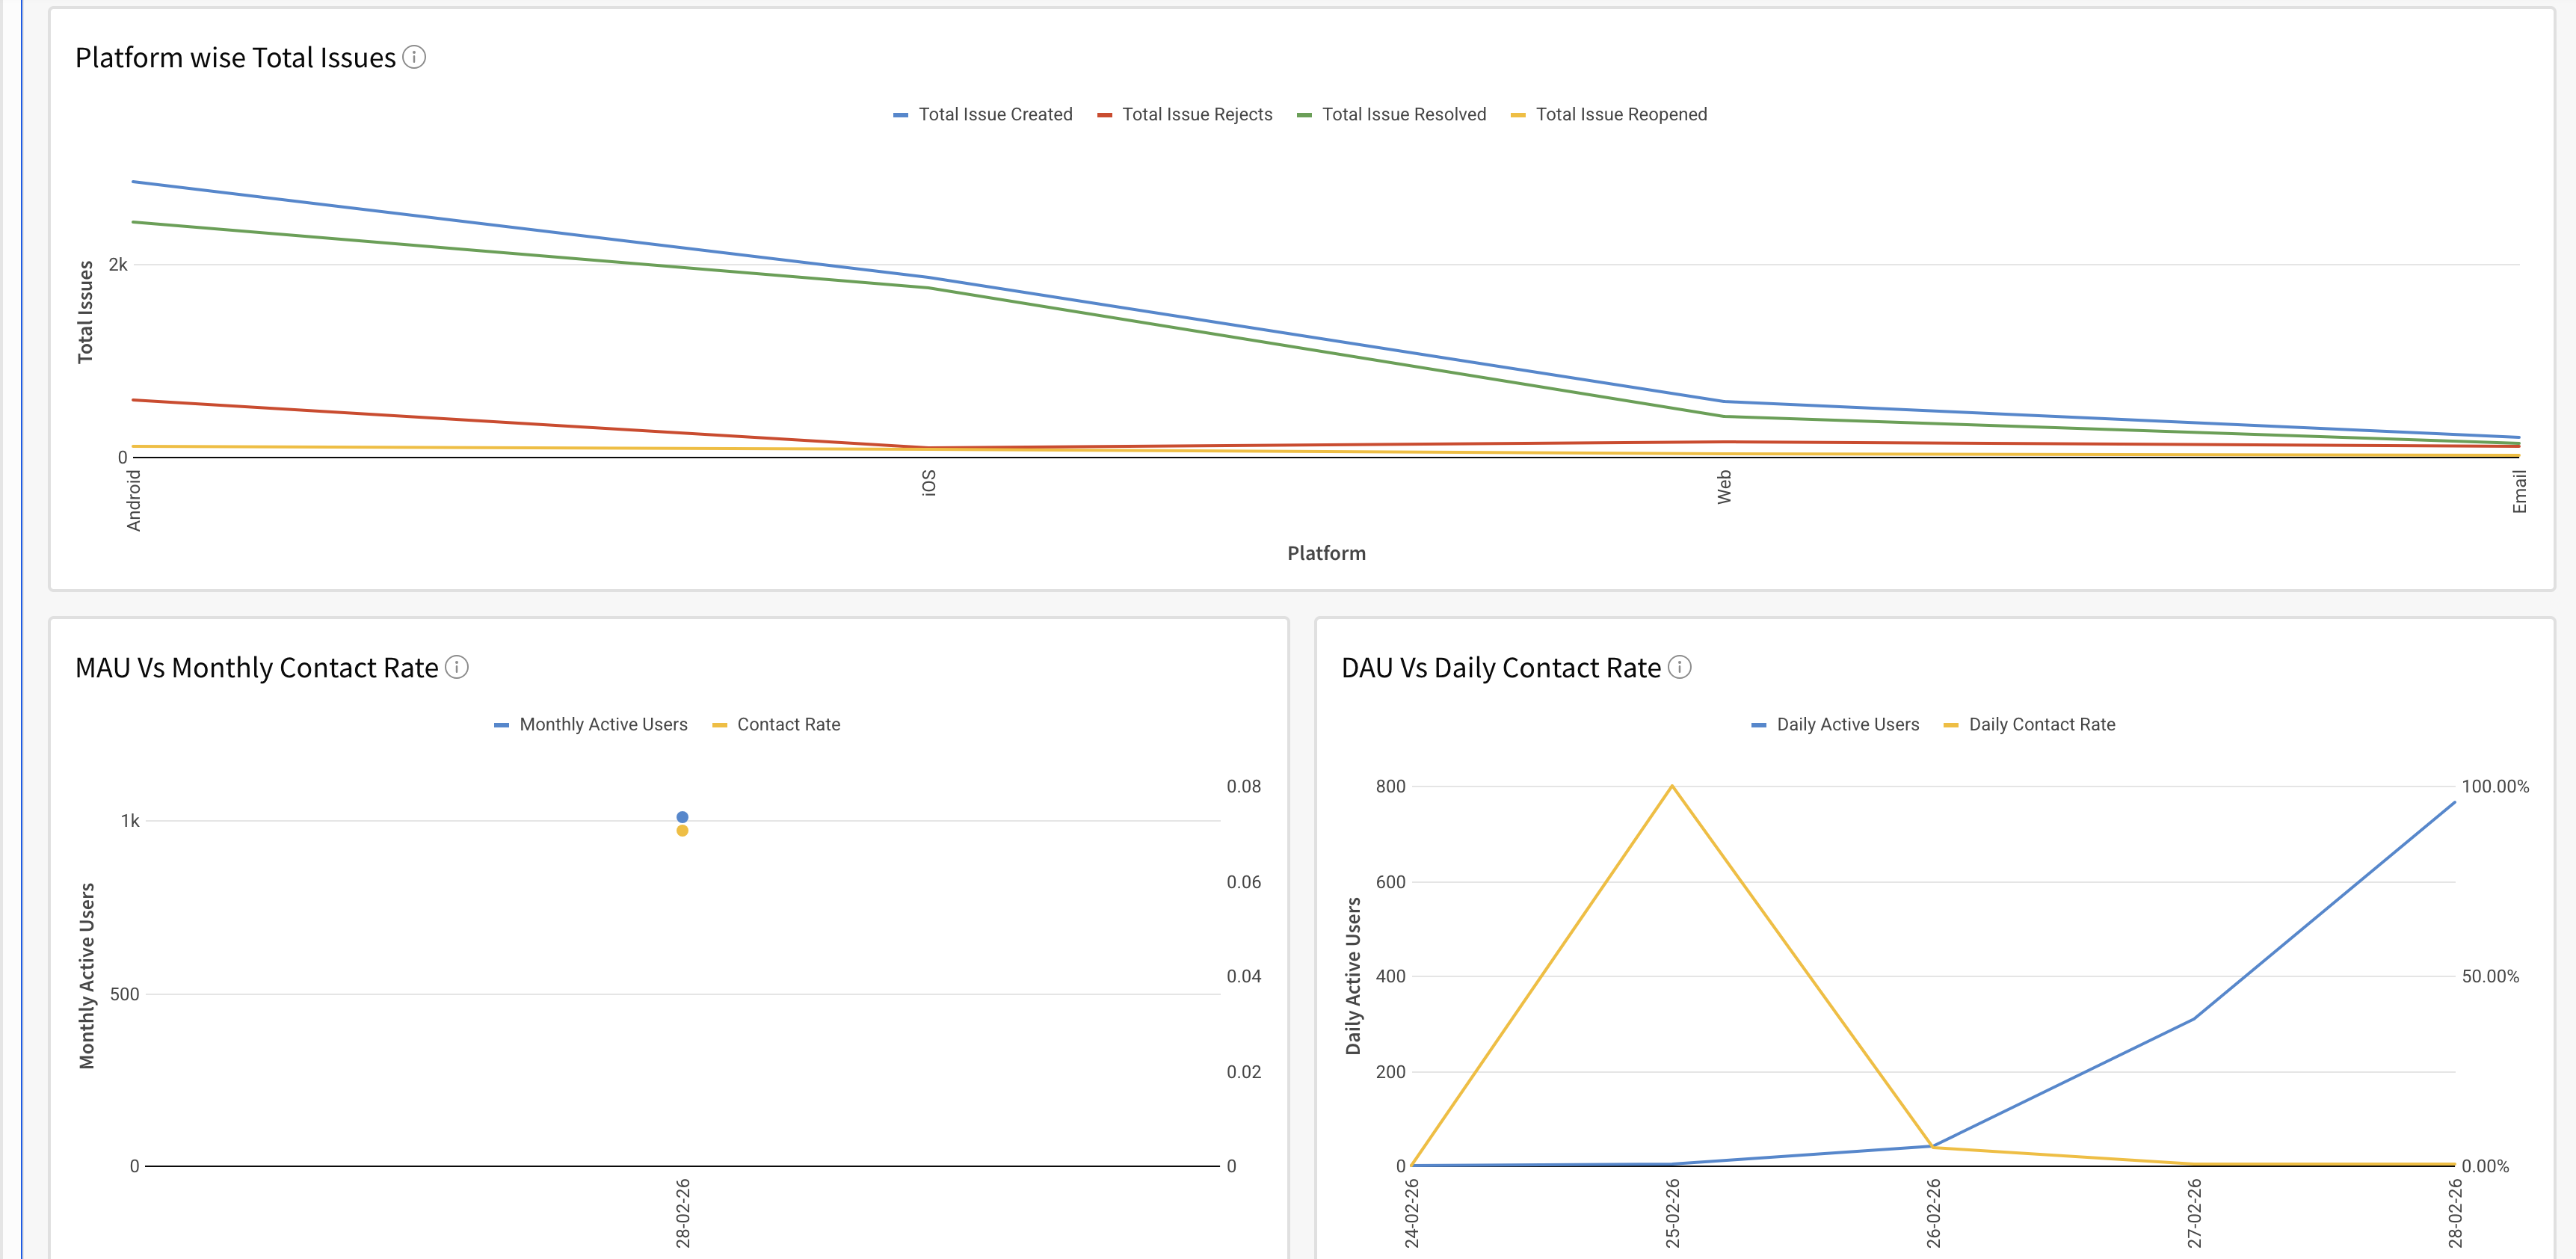
| Platform-wise Total Issues | Shows the total number of issues created, issues resolved, issues rejected, and issues reopened across different platforms | Total issue created = Sum([Issues Created Count]) Total issue Rejected = Sum([Issues Rejects Count]) Total issue Reopened = Sum([Issues Reopens Count]) Total issue Resolved = Sum([Issues Resolves Count]) |
| MAU vs Monthly Contact Rate | Compares monthly active users with contact rate to analyze support demand relative to the user base | MAU: SUM(UNIQUE_USER_COUNT Monthly Contact Rate= SUM(ISSUES_CREATED_COUNT) / SUM(UNIQUE_USER_COUNT) |
| DAU vs Daily Contact Rate | Compares daily active users with contact rate to track daily support demand trends | DAU: SUM(UNIQUE_USER_COUNT) Daily Contact Rate = SUM(ISSUES_CREATED_COUNT) / SUM(UNIQUE_USER_COUNT) |
| Total User Growth Over Time | Shows the trend of total users over time to track user growth patterns | CountDistinct([Profile Id]) |
| Number of App Launches Over Time | Shows how app launches trend over the selected time period | SUM(WIDGET_LOAD_COUNT) |
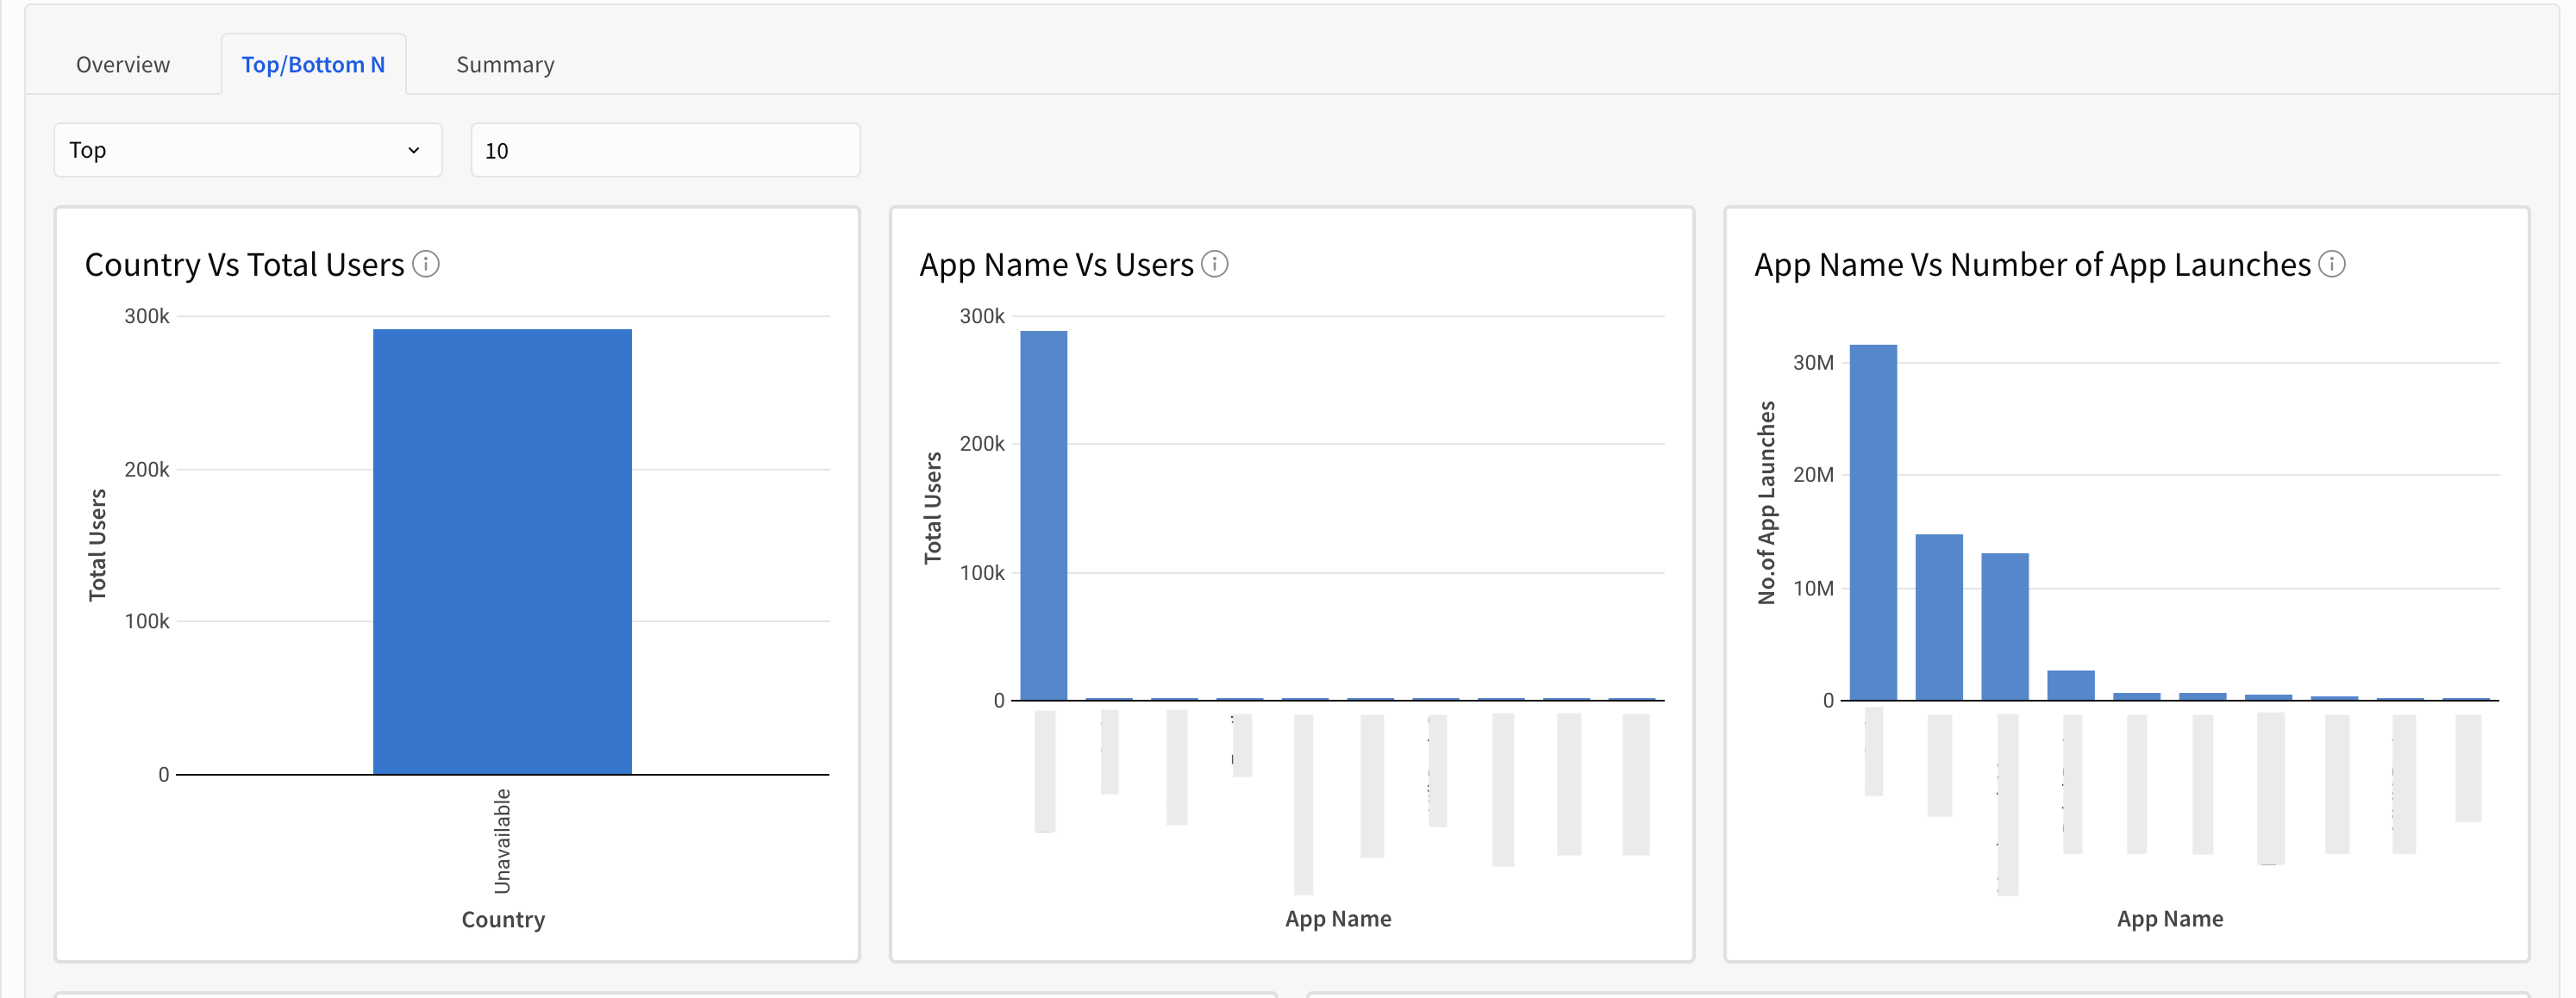
| Top/Bottom N Country-wise Total Users | Shows the distribution of users across different countries | CountDistinct([Profile Id]) |
| Top/Bottom N App Name-wise Users | Shows total users segmented by app | CountDistinct([Profile Id]) |
| Top/Bottom N App Name-wise Number of App Launches | Shows total app launches across different apps | SUM(WIDGET_LOAD_COUNT) |
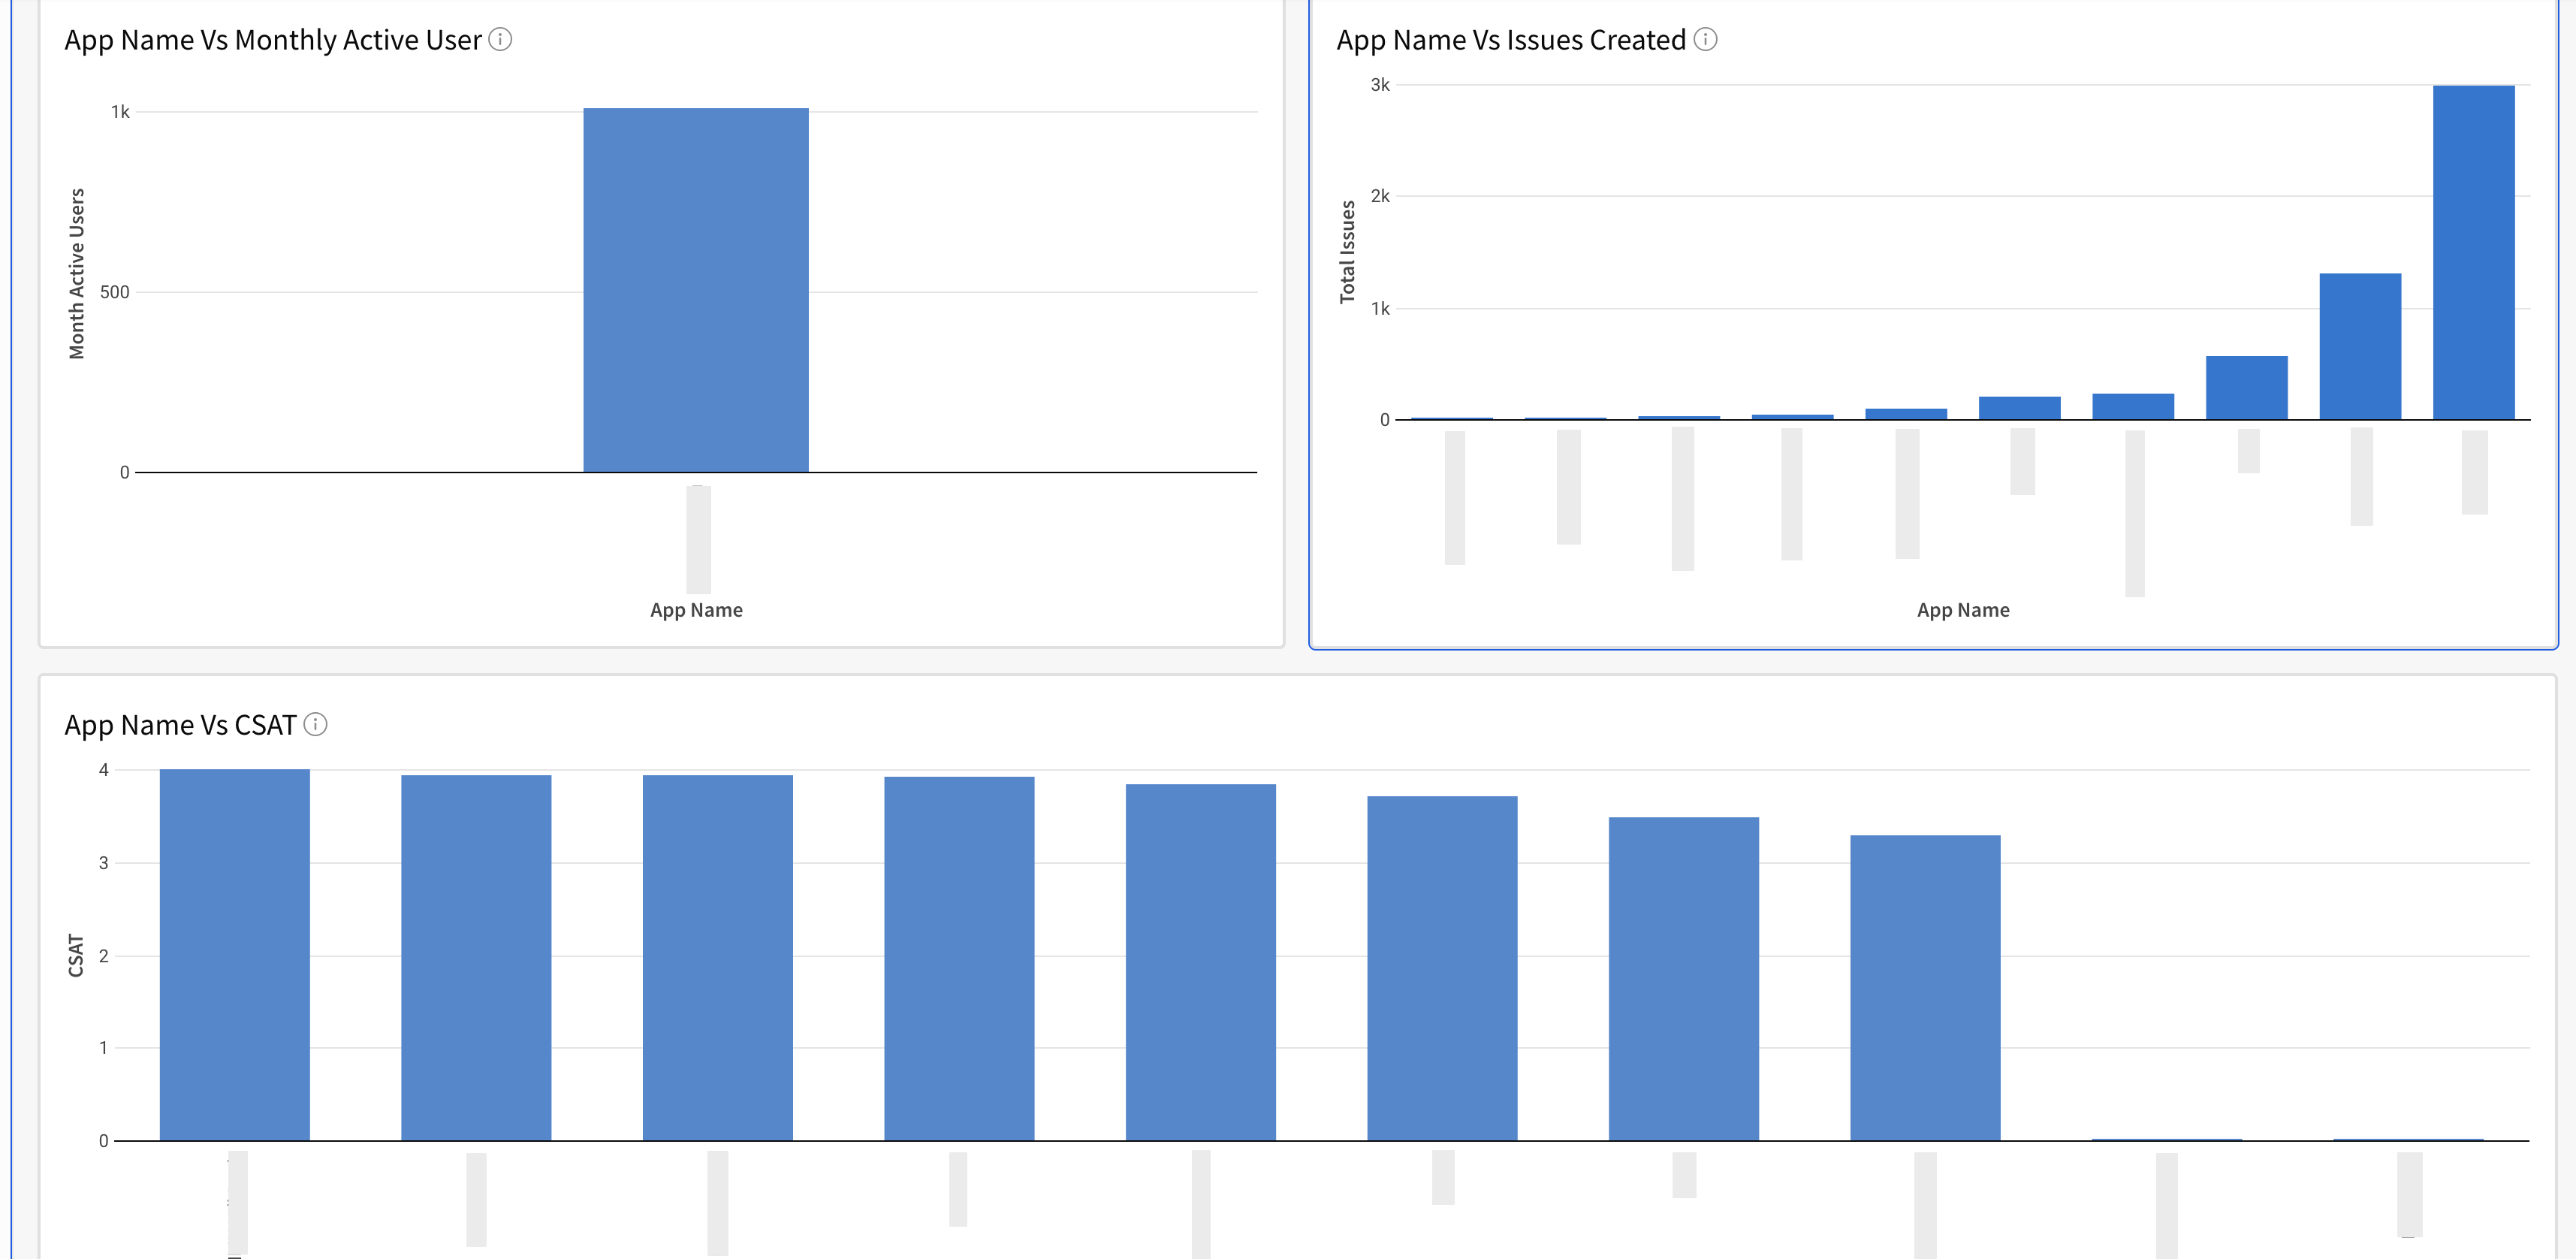
| Top/Bottom N App Name-wise Monthly Active Users | Shows monthly active users for each app | SUM(UNIQUE_USER_COUNT) |
| Top/Bottom N App Name-wise Issues Created | Shows the total number of issues created for each app | Sum([Issues Created Count]) |
| Top/Bottom N App Name-wise CSAT | Shows the average customer satisfaction score across apps | Sum([Csat Sum]) / Sum([Csat Count]) |
| Summary Table | A consolidated view of all metrics, grouped by date, to track performance trends and compare metrics across time periods at a glance. | All the calculations are the same as metric level calculation, and put all together in Tables as a Summary. |
Note: Metrics such as Active Users and Contact Rate rely on App Profile data. Please upgrade your SDK and integrate the new Identity Login API to enable App Profiles.
The Apps template provides curated visualizations to help you quickly answer most of your insights. You can further customize these templates to fit your exact needs. Below is a breakdown of the available metrics.
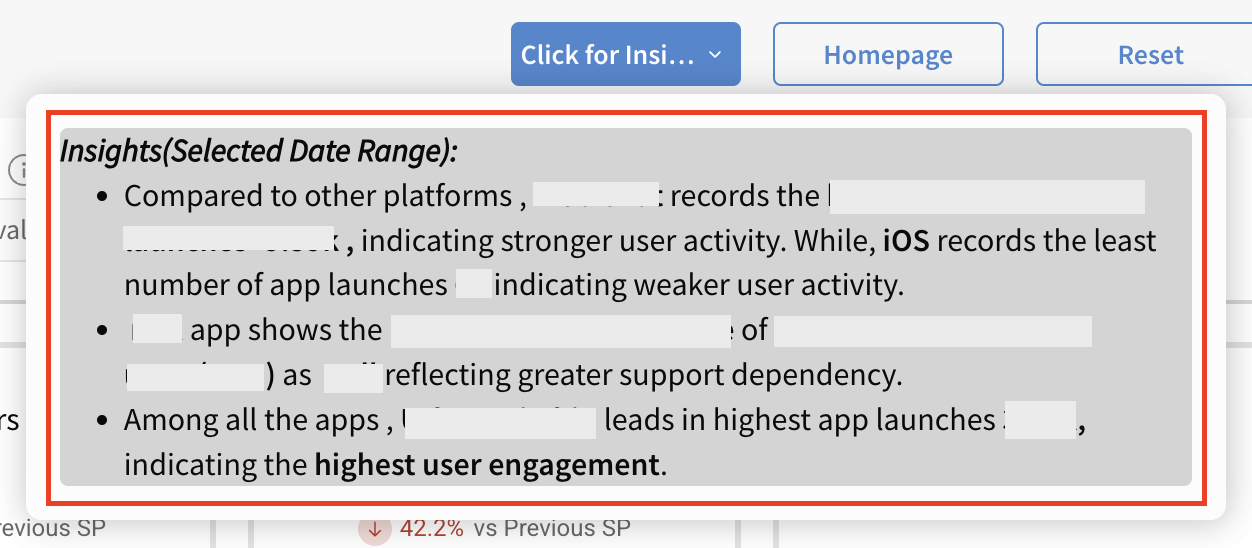
Pro Tip: Click the Click on Insights button to quickly view key insights from the report.
| Overview |
|
| Top/Bottom N Charts |
  |
Summary Section
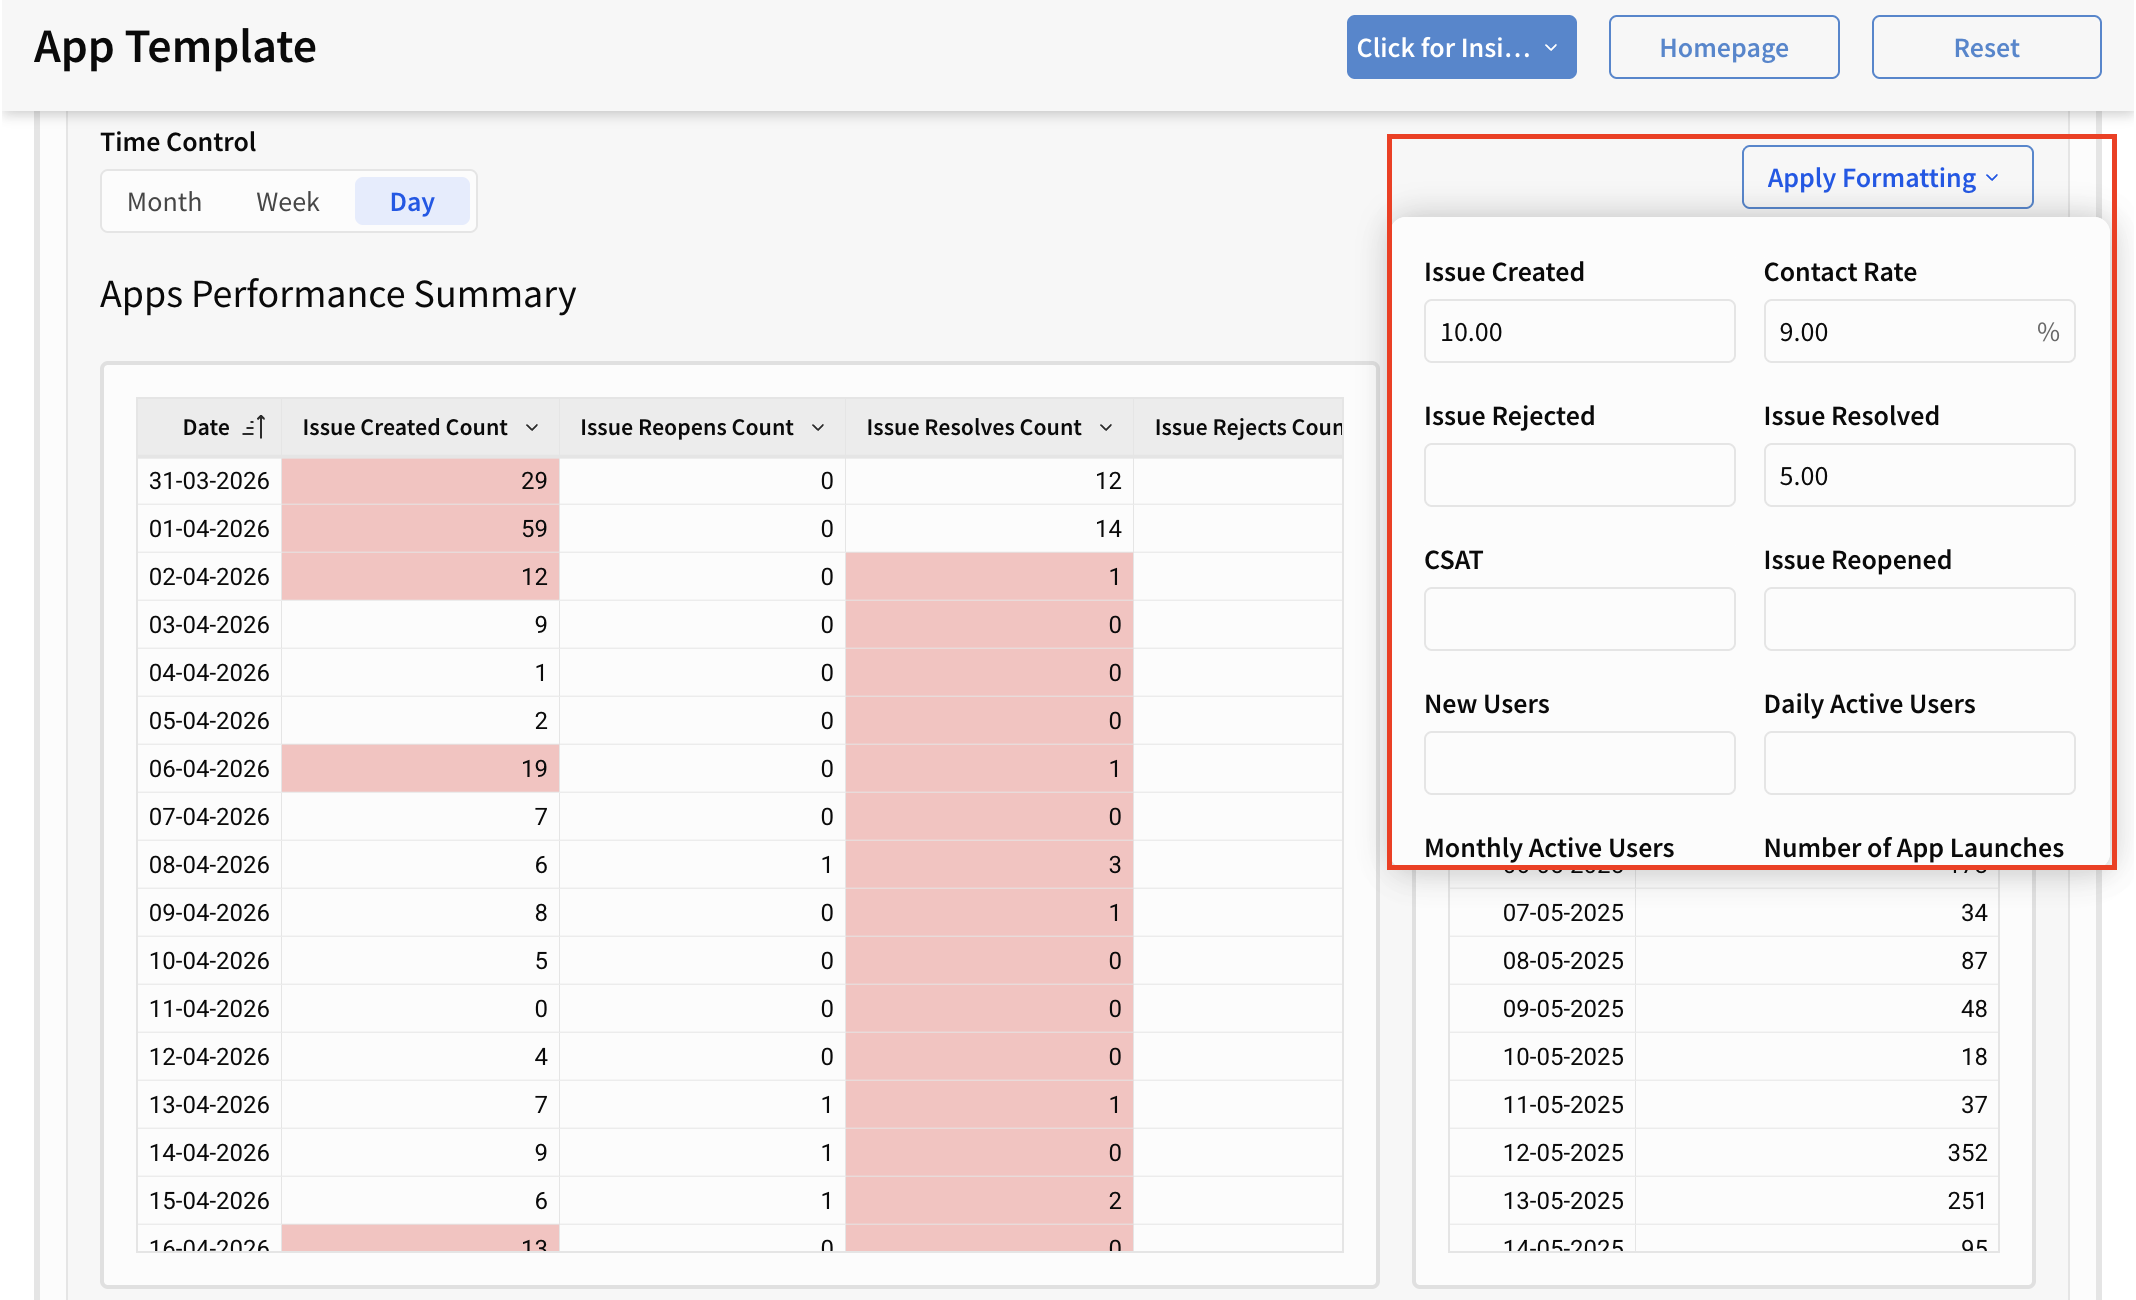
All the metrics mentioned above are also available in table format in the Summary Section. You can also download the data for every table in various formats by clicking on the Export option.
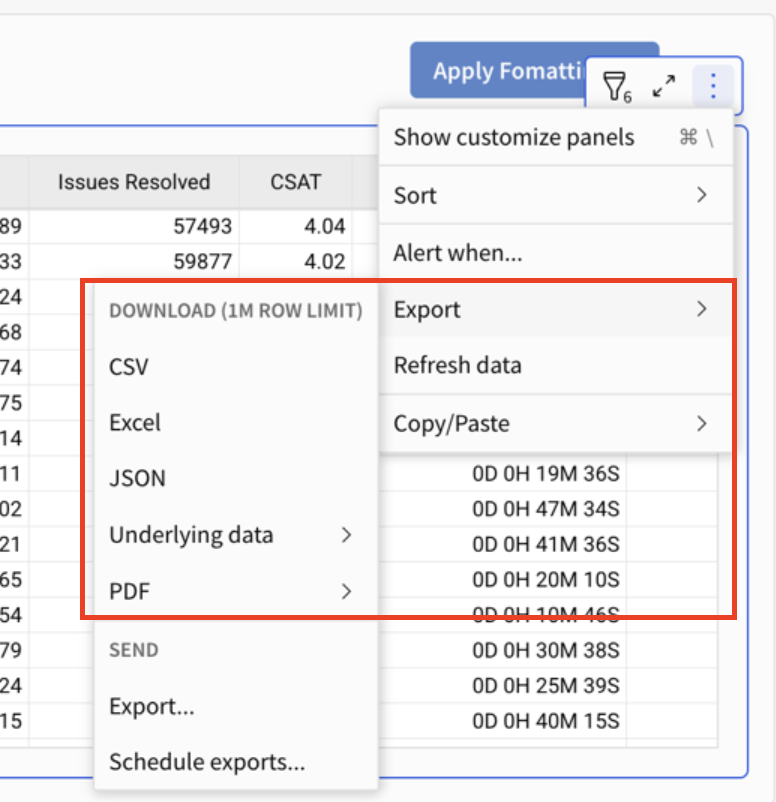
Pro Tip: Use Apply Formatting (top-right of the template) to instantly apply conditional formatting and highlight key metrics within the table. For example, you can set a rule to highlight values when Issues Created exceed 10, making it easier to spot trends and outliers at a glance.