The Bots template provides a comprehensive view of bot activity and efficiency, showing invocations, completions, and interruptions.
Note: To learn how to access and use the Bots template, refer to the Getting Started guide.
Exploring Bots Template
Metrics in the Bots template can be reviewed across various filters:
| Filter Name | Column | Applicable to Metrics |
| Date | UTC_TIME | ALL |
| App Name | APP_NAME | ALL |
| Platform | PLATFORM | ALL |
| Language | LANGUAGE | Applicable to all metrics except the Steps Invocation Summary Table |
| BOT Name | BOT Name | ALL |
| BOT Type | BOT Type Str | ALL |
Note: Use the Time Control at the bottom of the overview section to dynamically update all charts and tables below. You can adjust the data display by:
- Day: Track short-term fluctuations and daily performance.
- Week: Highlight weekly patterns (starts on Sunday).
- Month: View a high-level summary (starts on the 1st).
This flexibility enables you to quickly switch between insights, making it easier to identify trends over time.
Detailed information on each metric is given below:
| Metric Name | Description | Calculations |
| Issue Assigns / Invocations | Total number of times a bot was invoked on issues. | Sum([Invocations Count]) |
| Issue Assigns % | Percentage of issues where bots were invoked compared to total issue assignments. | Sum of Invocations Count/Sum of Issue Assigns Count |
| Agent Interruptions % | Percentage of bot invocations interrupted by human agents. | Sum([Agent Interruption Count]) / Sum([Invocations Count]) |
| Automation Interruptions % | Percentage of bot invocations interrupted by automated processes. | Sum([Automation Interruption Count]) / Sum([Invocations Count]) |
| Outbound Messages | Total outbound responses sent by Custom Bots. | Sum([Custombot Outbound Resp Count]) |
| BOT Interaction Time (Interruption) | Average time before a bot interaction was interrupted. Helps identify how long users stay engaged before requiring agent support. | Text(Floor(Zn(Sum([Interruption Time Sum Ms] / Sum([Interruptions Count]))) / 86400000)) & "D " & Text(Floor(Mod(Zn(Sum([Interruption Time Sum Ms] / Sum([Interruptions Count]))), 86400000) / 3600000)) & "H " & Text(Floor(Mod(Zn(Sum([Interruption Time Sum Ms] / Sum([Interruptions Count]))), 3600000) / 60000)) & "M " & Text(Floor(Mod(Zn(Sum([Interruption Time Sum Ms] / Sum([Interruptions Count]))), 60000) / 1000)) & "S" |
| BOT Interaction Time (Completion) | Average time taken to complete bot interactions. Measures the efficiency of bot flows and user satisfaction with resolution speed. | Text(Floor(Zn(Sum([Completion Time Sum Ms] / Sum([Completions Count]))) / 86400000)) & "D " & Text(Floor(Mod(Zn(Sum([Completion Time Sum Ms] / Sum([Completions Count]))), 86400000) / 3600000)) & "H " & Text(Floor(Mod(Zn(Sum([Completion Time Sum Ms] / Sum([Completions Count]))), 3600000) / 60000)) & "M " & Text(Floor(Mod(Zn(Sum([Completion Time Sum Ms] / Sum([Completions Count]))), 60000) / 1000)) & "S" |
| Invocations Vs Completions | Comparison between how many times bots were invoked vs. successfully completed. Shows the success rate of bots and highlights gaps in completion. | Invocations - Sum([Invocations Count]) Completions - |
| Invocations Vs Agent Interruption % Vs Automation Interruption % | Multi-metric view comparing invocations with interruption rates by agents and automation, respectively.Provides a holistic view of bot performance and failure points. | Invocations - Sum([Invocations Count]) |
| BOT Interaction Time (Interruption) | Average time (in Hrs) before a bot interaction was interrupted. Helps identify how long users stay engaged before requiring agent support. | (Sum([Interruption Time Sum Ms]) / 3600000) / Sum([Interruptions Count]) |
| BOT Interaction Time (Completion) | Average time (in Hrs) taken to complete bot interactions. Measures the efficiency of bot flows and user satisfaction with resolution speed. | (Sum([Completion Time Sum Ms]) / 3600000) / Sum([Completions Count]) |
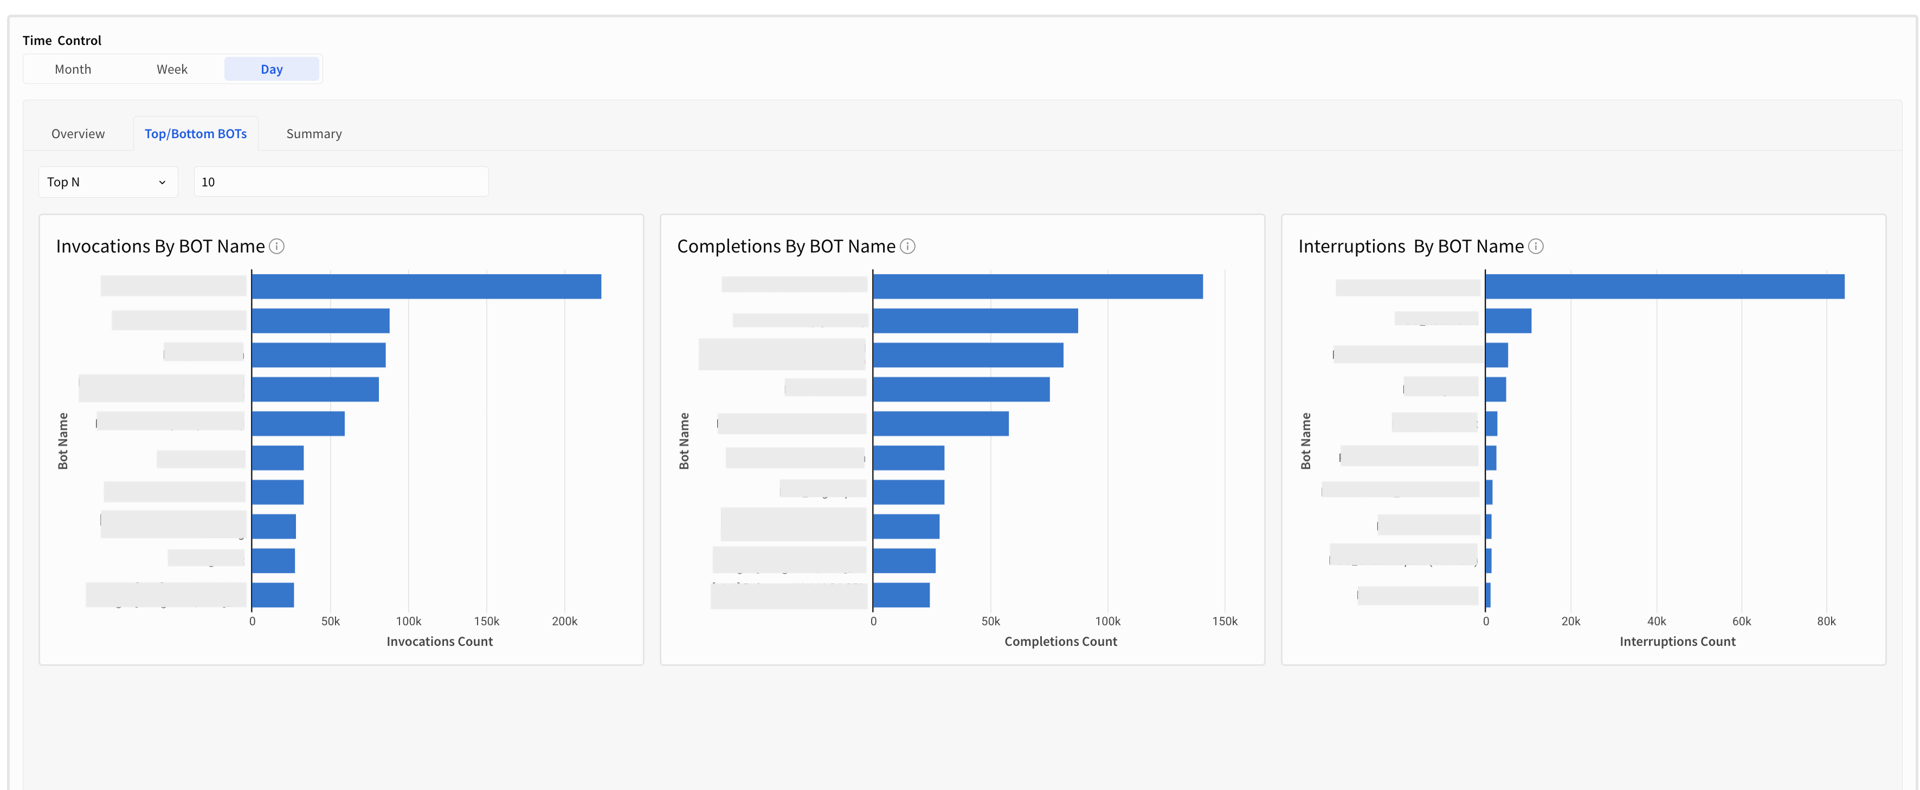
| Top/Bottom N Invocations by BOTs Name | Ranking of bots by number of invocations (top or bottom performers).Identifies the most and least used bots | Sum([Invocations Count]) |
| Top/Bottom N Completions by BOTs Name | Ranking of bots by number of completions (top or bottom performers). Shows which bots deliver successful outcomes most often. | Sum([Completions Count]) |
| Top/Bottom N Interruptions by BOTs Name | Ranking of bots by number of interruptions (top or bottom performers). Highlights problematic bots that frequently fail, helping prioritize improvements. | Sum([Interruptions Count]) |
| Summary Table | A consolidated view of all metrics, grouped by date, to track performance trends and compare metrics across time periods at a glance. | All the calculations are the same as metric level calculation, and put all together in Tables as Summary |
Note: Metrics such as Active Users and Contact Rate rely on App Profile data. Please upgrade your SDK and integrate the new Identity Login API to enable App Profiles.
The Bots template provides curated visualizations to help you quickly answer most of your insights. You can further customize these templates to fit your exact needs. Below is a breakdown of the available metrics.
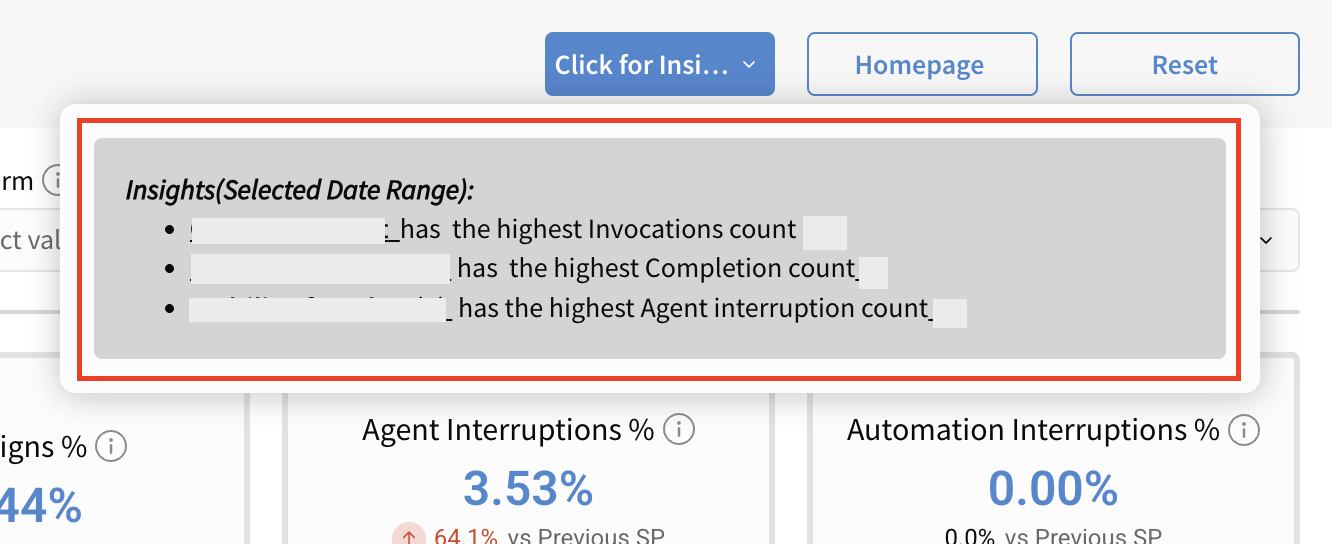
Pro Tip: Click the Click on Insight button to quickly view key insights from the report.
| Overview |
 |
| Top/Bottom N |
 |
Summary Section
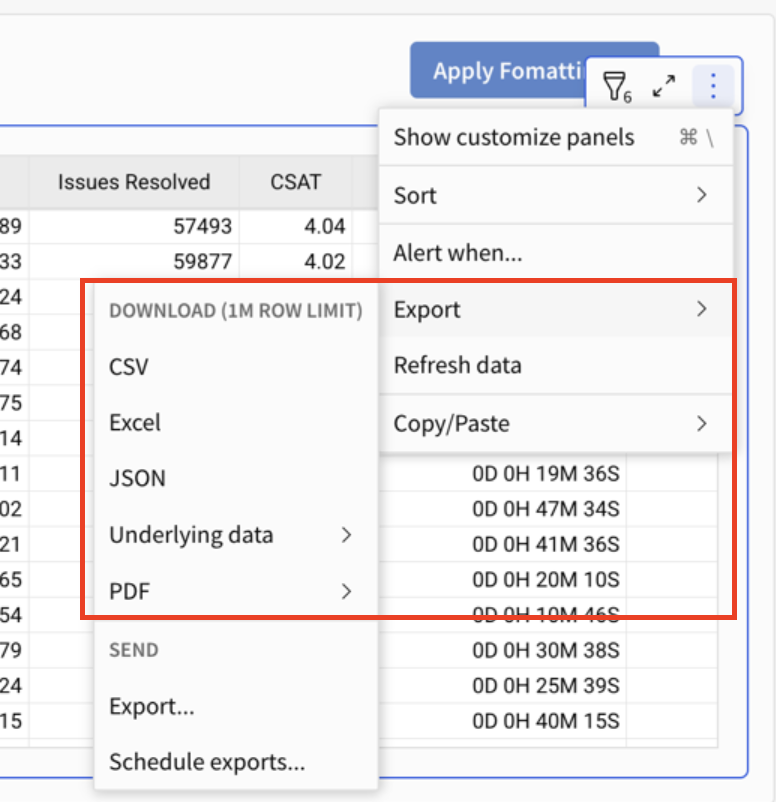
All the metrics mentioned above are also available in table format in the Summary Section. You can also download the data for every table in various formats by clicking on the Export option.
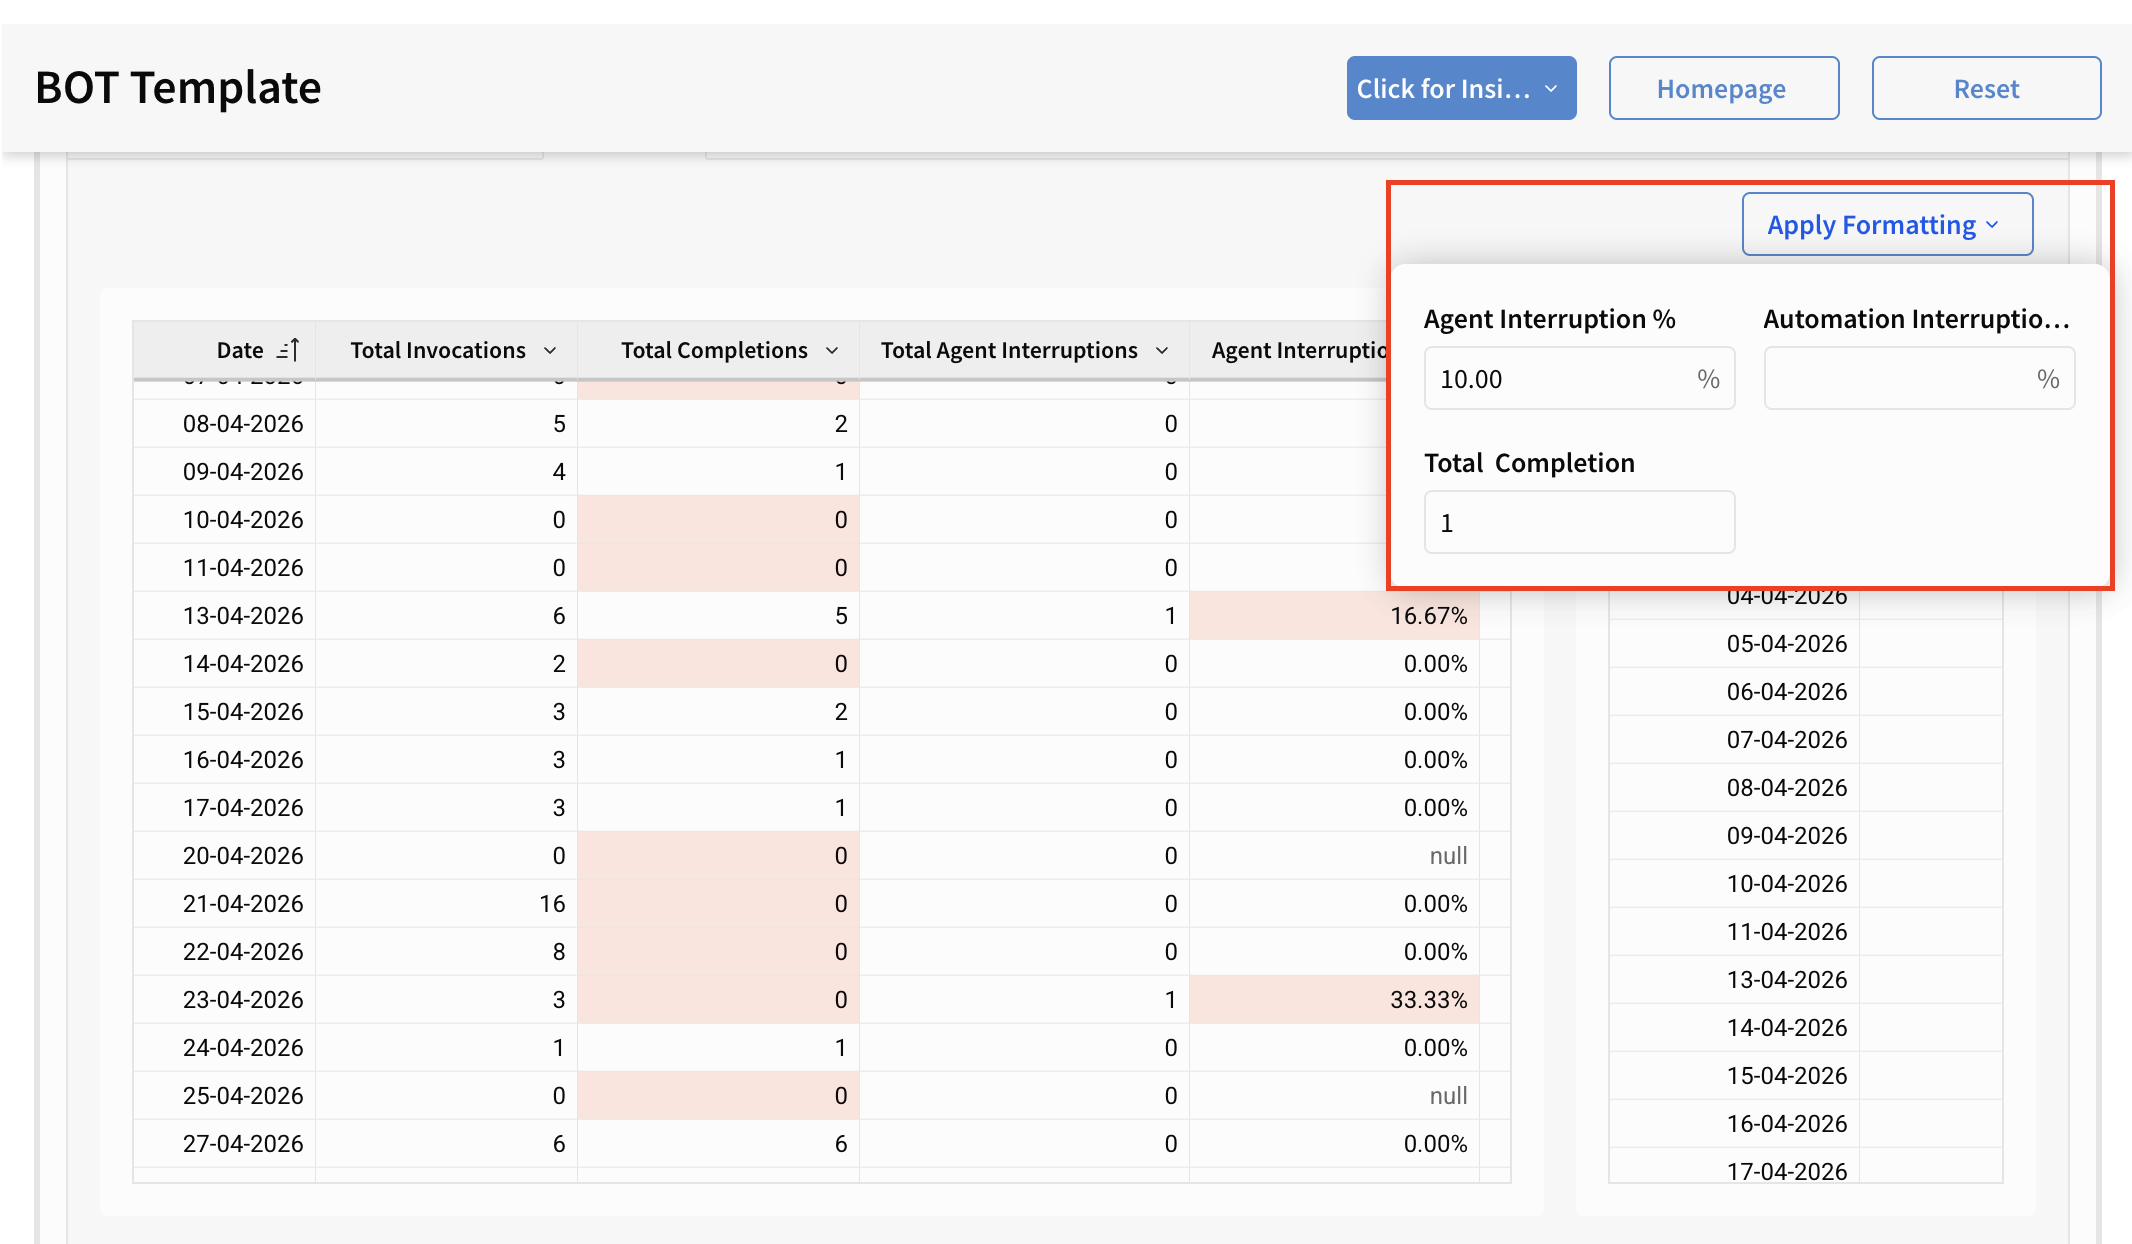
Pro Tip: Use Apply Formatting (top-right of the template) to instantly apply conditional formatting and highlight key metrics within the table. For example, you can set a rule to highlight values when Agent Interruption % exceeds 10%, making it easier to spot trends and outliers at a glance.