The Issues template tracks issue trends, resolution efficiency, backlog, and customer feedback, providing a clear view of performance and user experience.
Note: To learn how to access and use the Issues template, refer to the Getting Started guide.
Exploring Issues Template
Metrics in the Issues template can be reviewed across various filters:
| Filter Name | Column | Applicable to Metrics |
| Date | CREATED_TIMESTAMP | ALL |
| App Name | APP_NAME | ALL |
| Platform | PLATFORM | ALL |
| Language | LANGUAGE | ALL |
| Intent Name | LABEL | ALL |
| Issue Automation Category | ISSUE_AUTOMATION_CATEGORY | ALL |
| Issue Automation SubCategory | ISSUE_AUTOMATION_SUBCATEGORY | ALL |
Note: Use the Time Control at the bottom of the overview section to dynamically update all charts and tables below. You can adjust the data display by:
Day: Track short-term fluctuations and daily performance.
Week: Highlight weekly patterns (starts on Sunday).
Month: View a high-level summary (starts on the 1st).
This flexibility enables you to quickly switch between insights, making it easier to identify trends over time.
Detailed information on each metric is given below:
| Metric Name | Description | Calculations |
| Total Issues Created | No. of Issues being Created in Selected time period | Count (Created_Timestamp) |
| Issues Resolved % | Shows the percentage of Issues Resolved within the selected time period | Sum([Issues Resolved Count]) / Sum([Issues Created Count]) Where Issues resolved Count =CountIf([Issue State] = "resolved") & Issues Created Count = Count([Selected Timezone]) |
| Issues Rejected % | Shows the percentage of Issues Rejected within the selected time period | Sum([Issues Rejected Count]) / Sum([Issues Created Count]) where Issues Rejected Count =CountIf([Issue State] = "rejected") & Issues Created Count = Count([Selected Timezone]) |
| Issues Reopened % | Shows the percentage of Issues Reopened within the selected time period | Sum([Total Reopened Count]) / Sum([Issues Created Count]) where Total Reopened Count =CountIf([Reopen Count] > 0) & |
| Issues Backlog % | Shows the percentage of pending Issues, representing the portion of created issues that are still unresolved or not rejected | Sum([Issues Backlog]) / Sum([Issues Created Count]) where Issues Backlog =Sum([Issues Created Count]) - (Sum([Issues Resolved Count]) + Sum([Issues Rejected Count])) & Issues Created Count = Count([Selected Timezone]) |
| CSAT | Avg. CSAT for all issues that received the CSAT rating | Sum([Csat]) / Sum([Count of Csat Timestamp]) |
| Human TTFR | Avg time taken for the first human response after the initial Bot and Automation workflow is complete | Text(Floor(Zn(Avg([Time to First Human Resp Ms])) / 86400000)) & "D " & Text(Floor(Mod(Zn(Avg([Time to First Human Resp Ms])), 86400000) / 3600000)) & "H " & Text(Floor(Mod(Zn(Avg([Time to First Human Resp Ms])), 3600000) / 60000)) & "M " & Text(Floor(Mod(Zn(Avg([Time to First Human Resp Ms])), 60000) / 1000)) & "S") |
| Response Rate % | Shows the response rate percentage, representing the proportion of resolved issues for which customers provided feedback | (Sum([Resolution Accept Count]) + Sum([Resolution Reject Count])) / Sum([Resolve Count]) |
| Issue Volume(Time Wise) | Shows the trend of issues created, rejected, resolved, and reopened over time, helping track issue volume, resolution efficiency, and recurring problem patterns | issues created = Count([Selected Timezone]) rejected = CountIf([Issue State] = "rejected") resolved= CountIf([Issue State] = "resolved") reopened =CountIf([Reopen Count] > 0) |
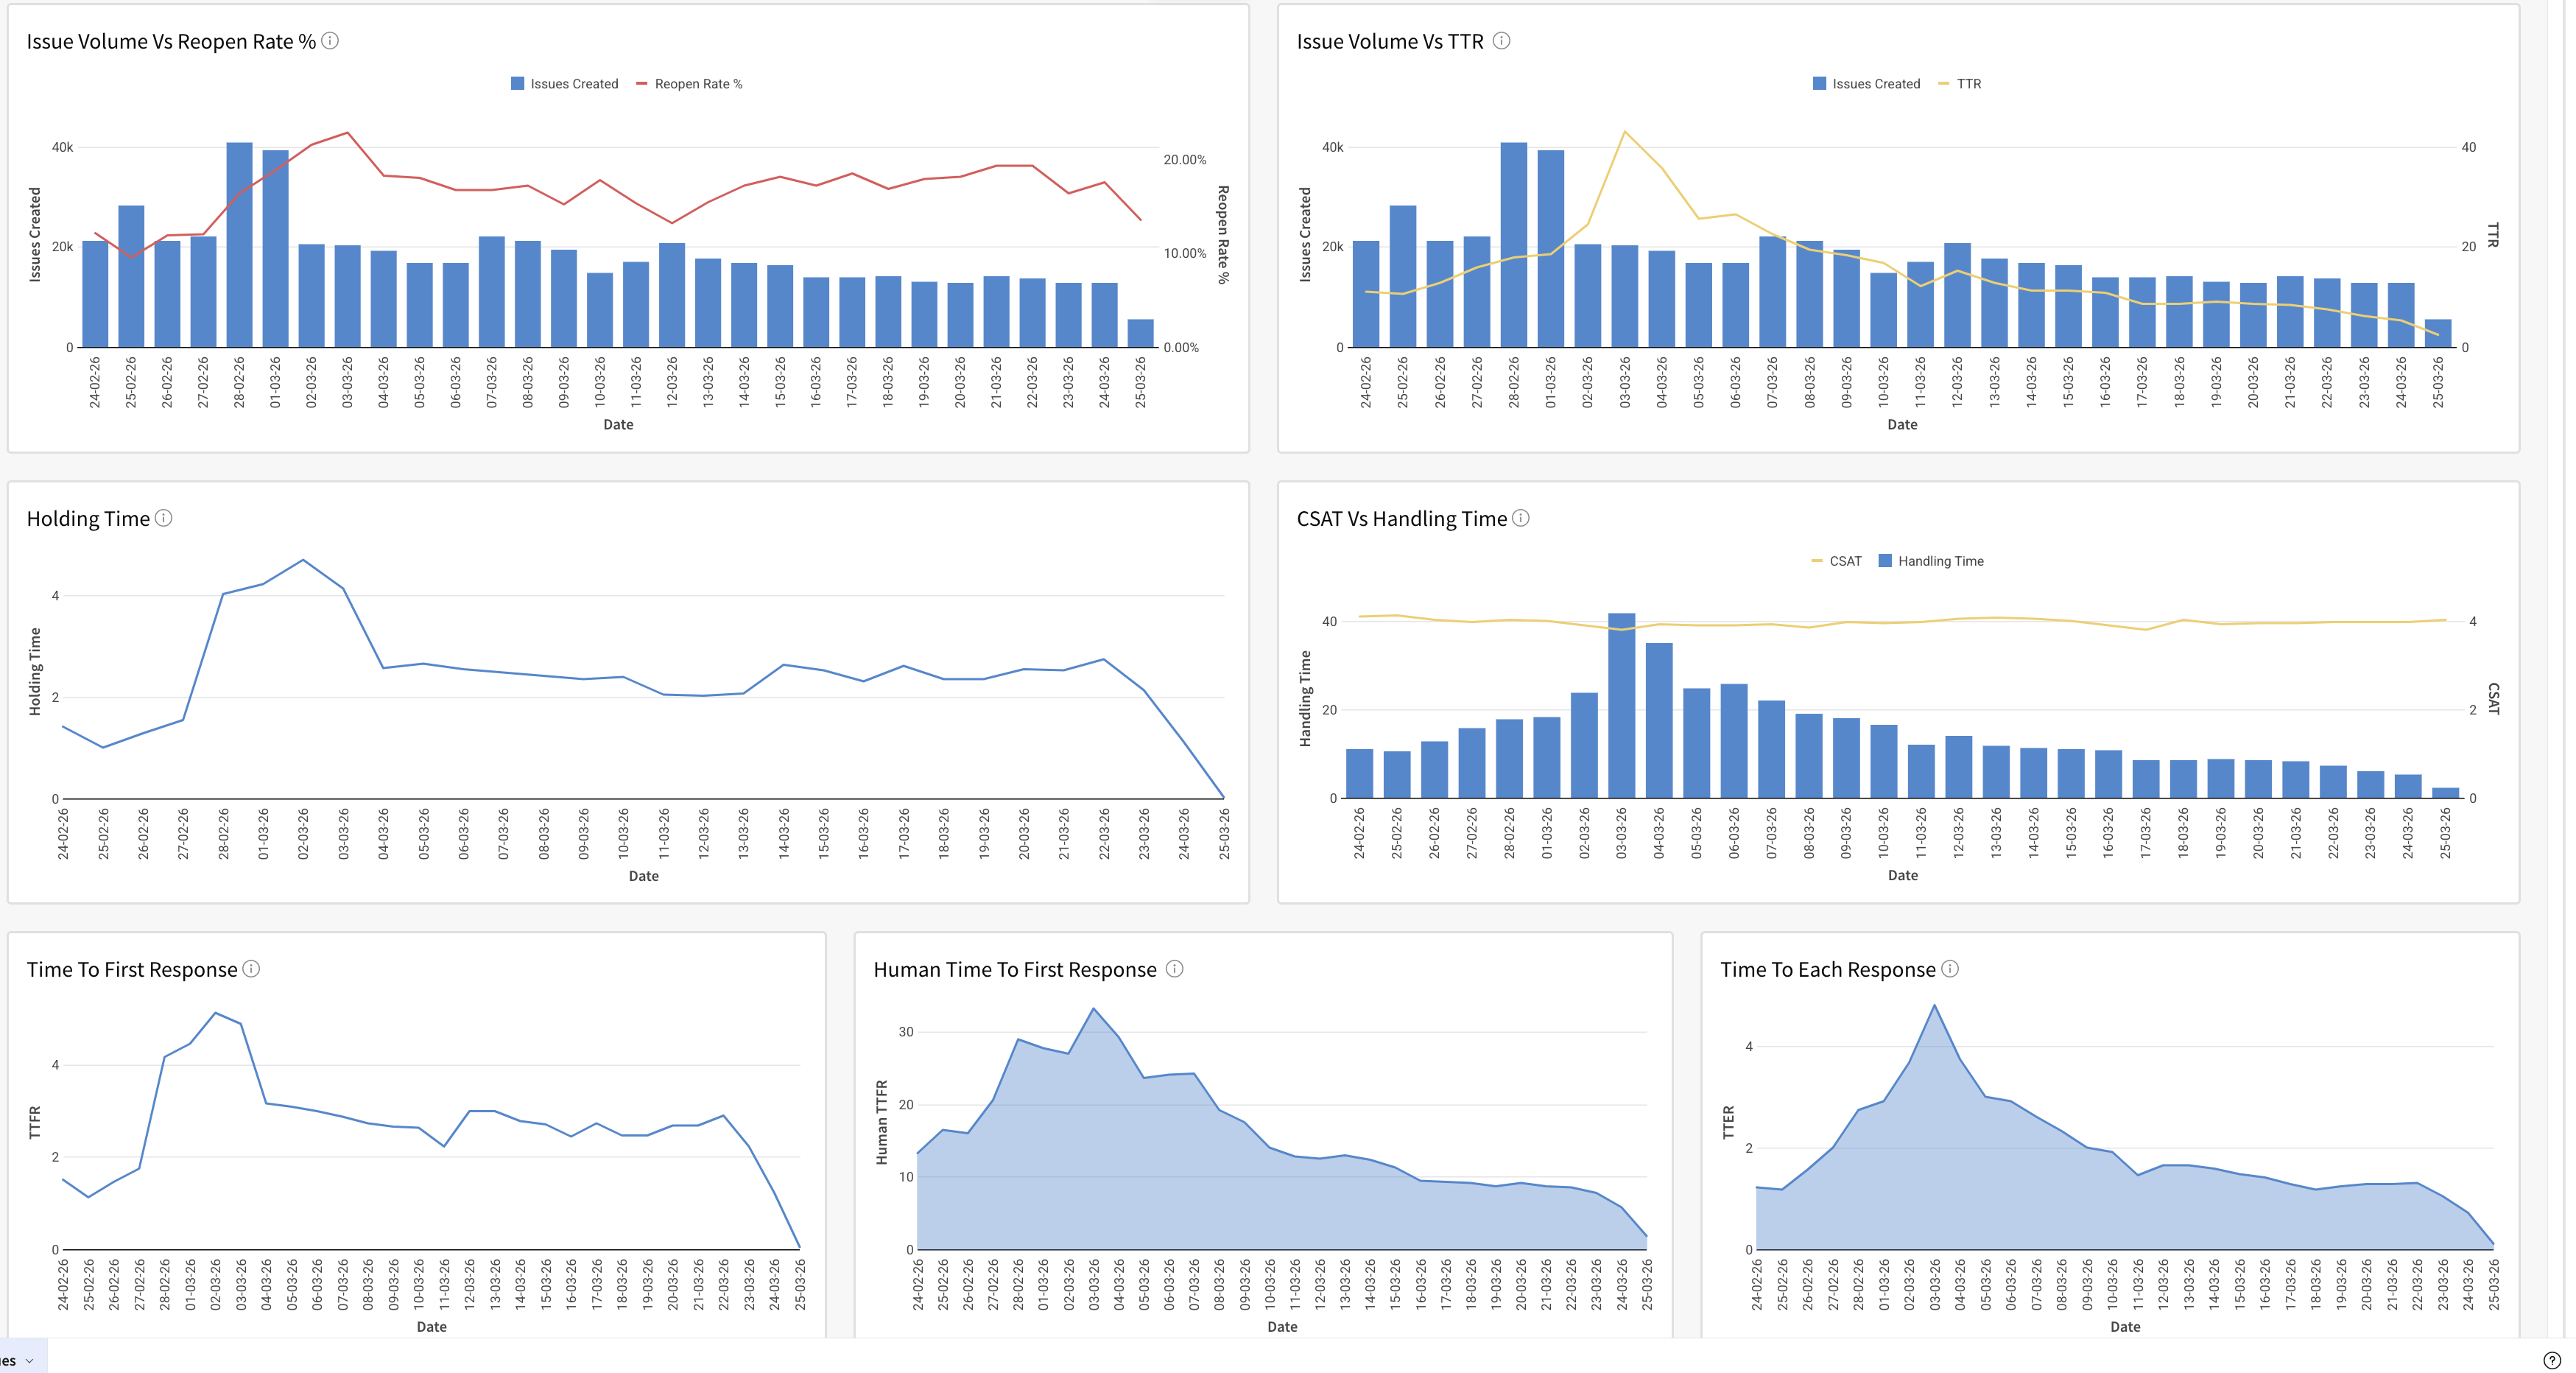
| Issue Volume Vs Reopen Rate % | Shows the trend of issues created compared with the reopen rate over time | issues created =Count([Selected Timezone]) reopen rate = CountIf([Reopen Count] > 0) |
| Issue Volume Vs TTR | Shows the trend of issues created alongside the average time to resolve over time, helping track how issue volume impacts resolution speed | issues created =Count([Selected Timezone]) TTR =Avg([TTR (hrs)]) where TTR(hrs)= Sum([Time to Resolve Ms]) / 3600000 |
| CSAT Vs Handling Time | Shows the relationship between CSAT and handling time, indicating how resolution time impacts customer satisfaction | CSAT =Sum([Csat]) / Sum([Count of Csat Timestamp]) Handling Time = Avg([Handling Time (Hrs)]) where Handling Time (Hrs) =Sum([Handling Time Ms]) / 3600000 |
| Holding Time Trend | Shows holding time over time, tracking how long it takes from issue assignment to the first response by an agent, bot, or AI | Avg([Holding Time (Hrs)]) where Holding Time (Hrs) =Sum([Holding Time Ms]) / 3600000 |
| Time To First Response | Shows time to first response over time, tracking how long it takes from issue creation to the first response by an agent, bot, or AI | Avg([Time to First Response Ms]) / 3600000 |
| Time To Each Response | Shows time per response over time, tracking the duration between consecutive responses for each issue | Sum([Time for Each Response (Hrs)]) / Sum([Time for Each Response Count]) where Time for Each Response (Hrs) = Sum([Time for Each Response Sum]) / 3600000 |
| Human Time To First Response Trend | Shows human time to first response over time, tracking how long it takes for a human agent to respond after all automated workflows are complete | Avg([Human TTFR (Hrs)]) where Human TTFR (Hrs) =[Time to First Human Resp Ms] / 3600000 |
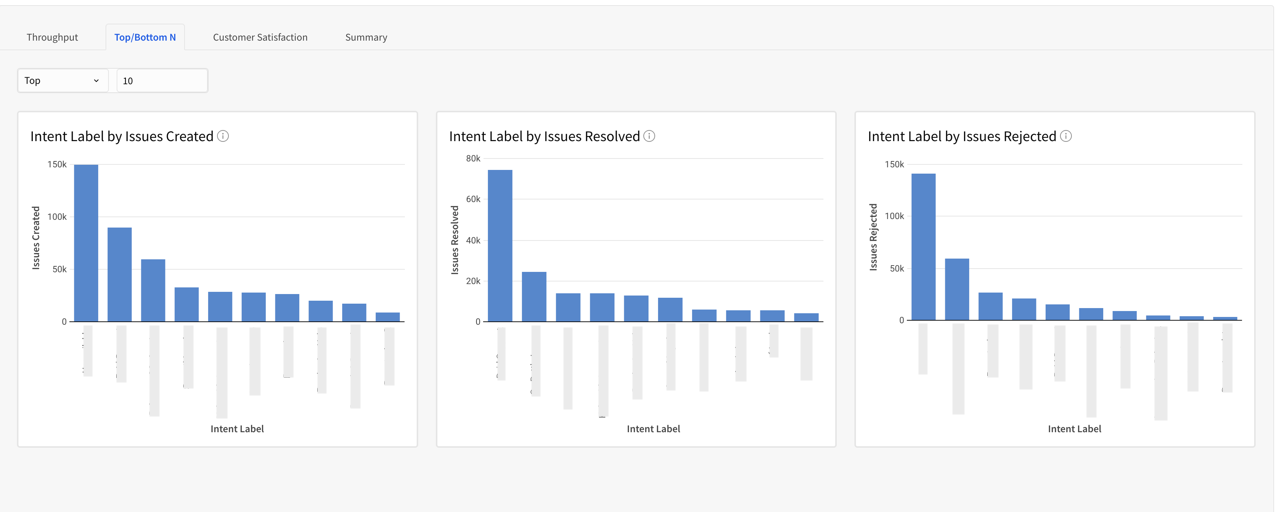
| Top/Bottom N Intent Label by Issues Created | Shows the top and bottom N intent labels by issues created, helping identify which user intents generate the most and least issues | issues created= Count([Selected Timezone]) |
| Top/Bottom N Intent Label by Issues Resolved | Shows the top and bottom N intent labels by issues resolved, highlighting which user intents are most successfully addressed | issues resolved=CountIf([Issue State] = "resolved") |
| Top/Bottom N Intent Label by Issues Rejected | Shows the top and bottom N intent labels by issues rejected, highlighting which user intents are most frequently rejected | Issues Rejected = CountIf([Issue State] = "rejected") |
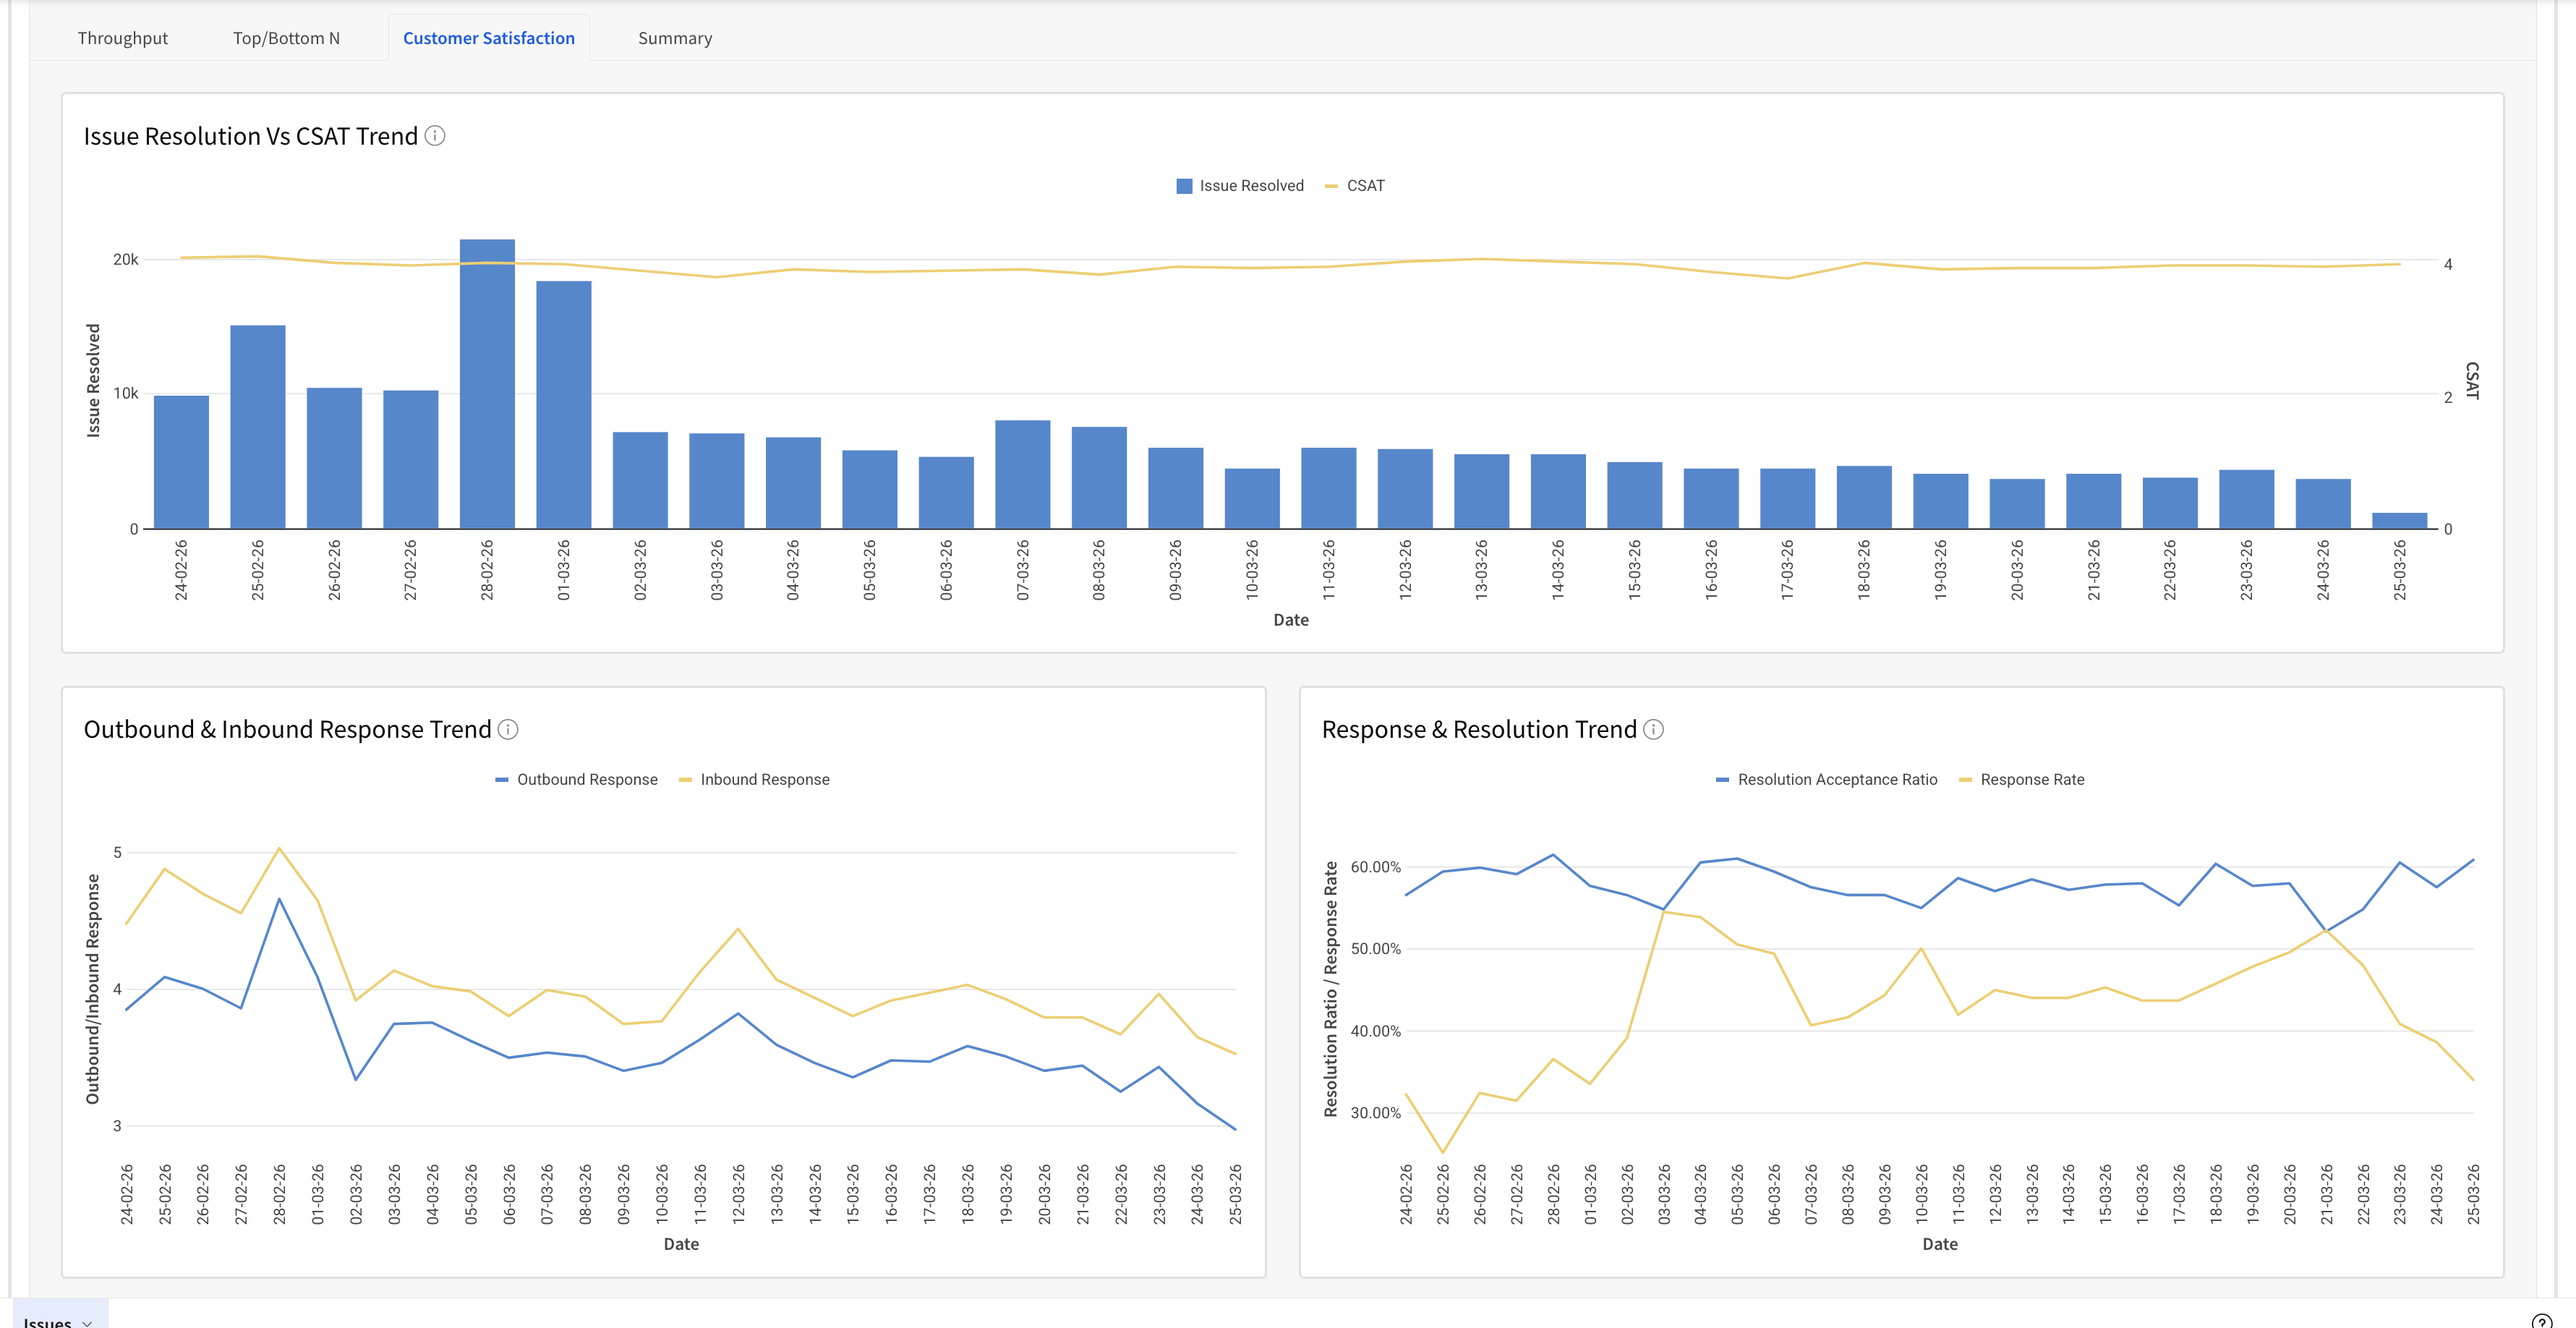
| Issue Resolution Vs CSAT Trend | Shows the trend of issues resolved versus CSAT rating over time, highlighting how resolution of issues impacts customer satisfaction | issues Resolved = CountIf([Issue State] = "resolved") CSAT =Sum([Csat (1)]) / Count([Csat Timestamp]) |
| Outbound and Inbound Response Trend | Shows the trend of outbound and inbound responses over time, tracking communication volume sent to and received from users | Outbound = Avg([Outbound Resp Count]) Inbound = Avg([Inbound Resp Count]) |
| Response & Resolution Trend | Shows the response and resolution trend over time, tracking how many resolved issues receive customer feedback and the percentage of resolutions marked as satisfactory | Response Trend =(Sum([Resolution Accept Count]) + Sum([Resolution Reject Count])) / Sum([Resolve Count]) Resolution Trend = Sum([Resolution Accept Count]) / (Sum([Resolution Accept Count]) + Sum([Resolution Reject Count])) |
| Summary Table | A consolidated view of all KPIs, grouped by date, to track performance trends and compare metrics across time periods at a glance. | All the calculations are the same as the KPI level calculation, and put all together in Tables as Summary |
Note: Metrics such as Active Users and Contact Rate rely on App Profile data. Please upgrade your SDK and integrate the new Identity Login API to enable App Profiles.
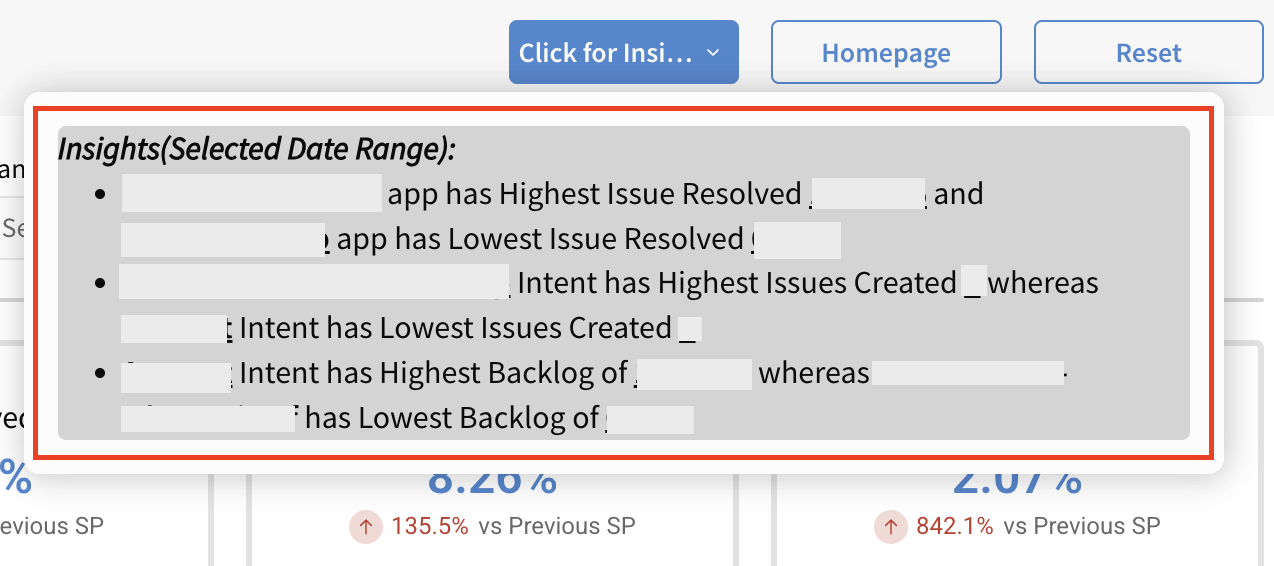
Pro Tip: Click the Click on Insight button to quickly view key insights from the report.
| Throughput |
  |
| Top/Bottom N |
 |
| Customer Satisfaction |
 |
Summary Section
All the metrics mentioned above are also available in table format in the Summary Section. You can also download the data for every table in various formats by clicking on the Export option.
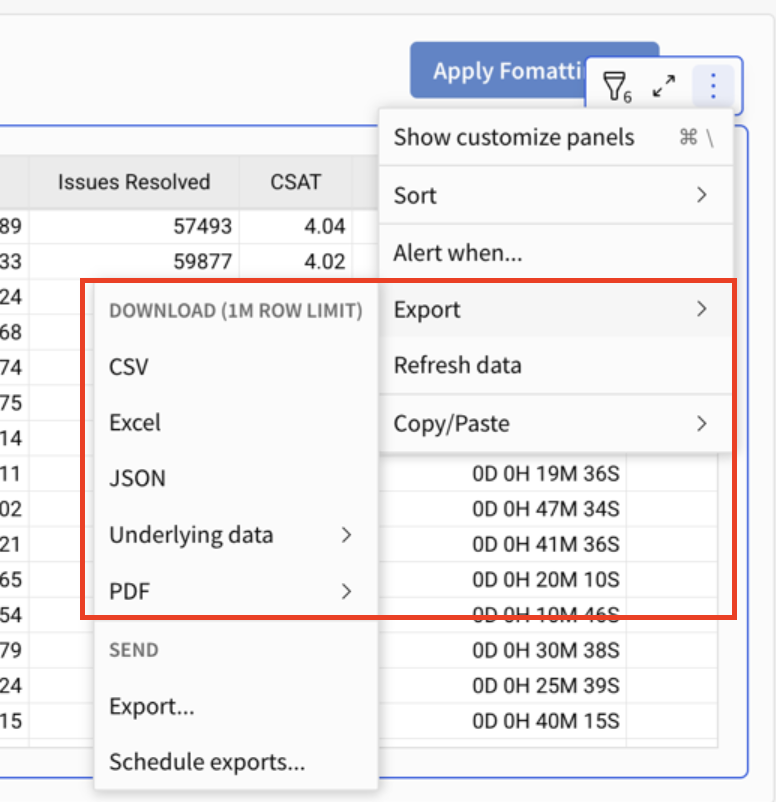
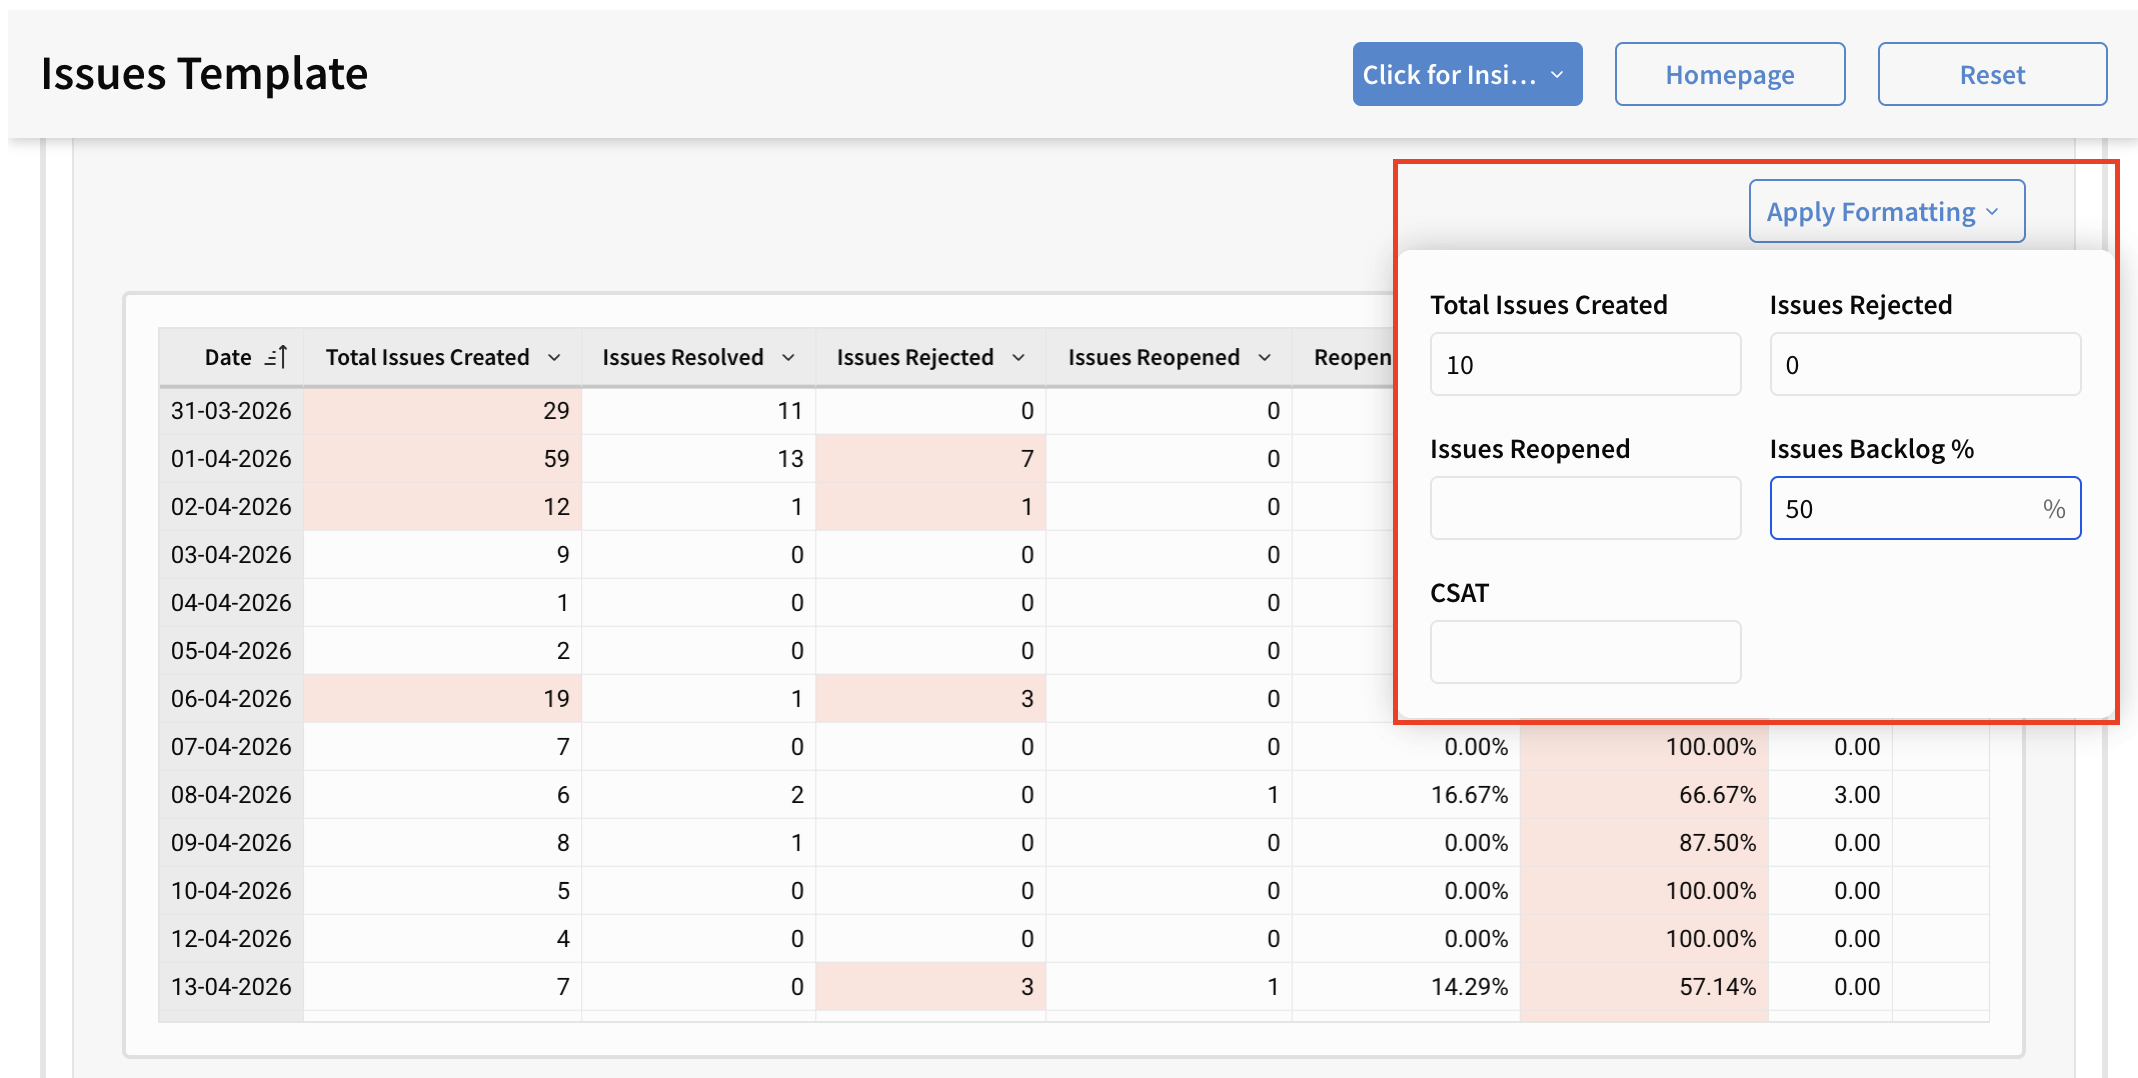
Pro Tip: Use Apply Formatting (top-right of the template) to instantly apply conditional formatting and highlight key metrics within the table. For example, you can set a rule to highlight values when Total Issues Created exceeds 10, making it easier to spot trends and outliers at a glance.