
The Teams template monitors operational efficiency and service quality by tracking agent availability and response speed.
Note: To learn how to access and use the Teams template, refer to the Getting Started guide.
Exploring Teams Template
You can refine the data in your template using several filters:
| Filter Name | Column | Applicable to Metrics |
| Date | UTC_Time | ALL |
| Team Name | TEAMS | ALL |
| Agent | AGENT | ALL |
| App Name | APP_NAME | Not applicable to Online/Available time or Summary Table metrics |
| Queue | QUEUE_NAME | Not applicable to Online/Available time or Summary Table metrics |
| Group Name | GROUP_NAME | Not applicable to the Group Summary Table |
| Platform | PLATFORM | Not applicable to Online/Available time or Summary Table metrics |
| Language | LANGUAGE | Not applicable to Online/Available time or Summary Table metrics |
Note:
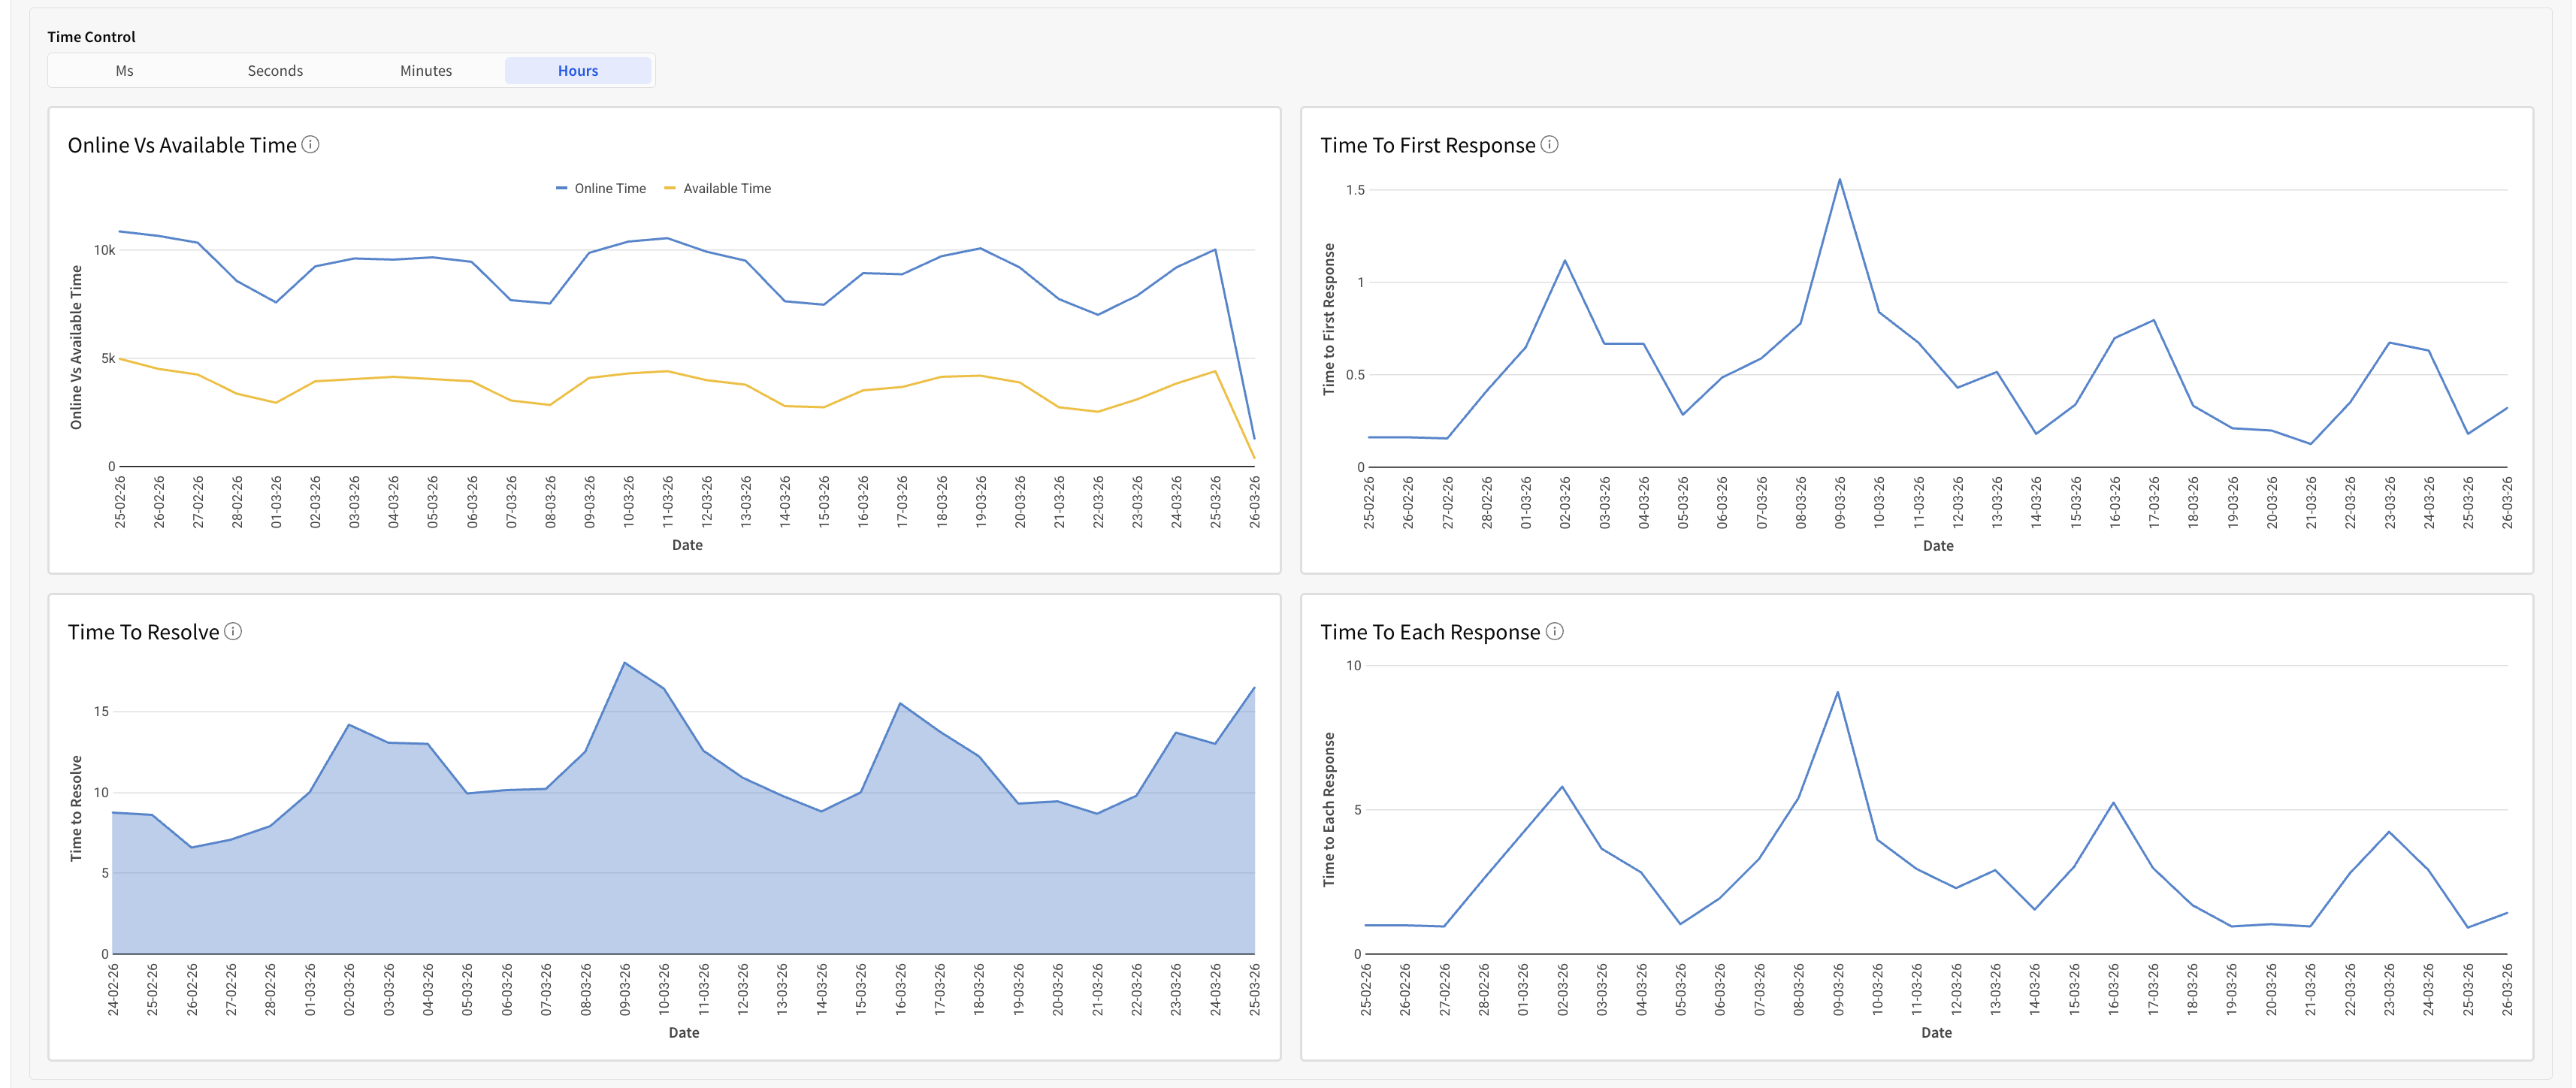
- A segmented Time Control is located in the overview container of the chart section. This control lets you toggle between minutes, Seconds, Minutes, and Hours to determine how time data is displayed on specific charts and to give you granular-level insights into teams' availability, performance, and activity.
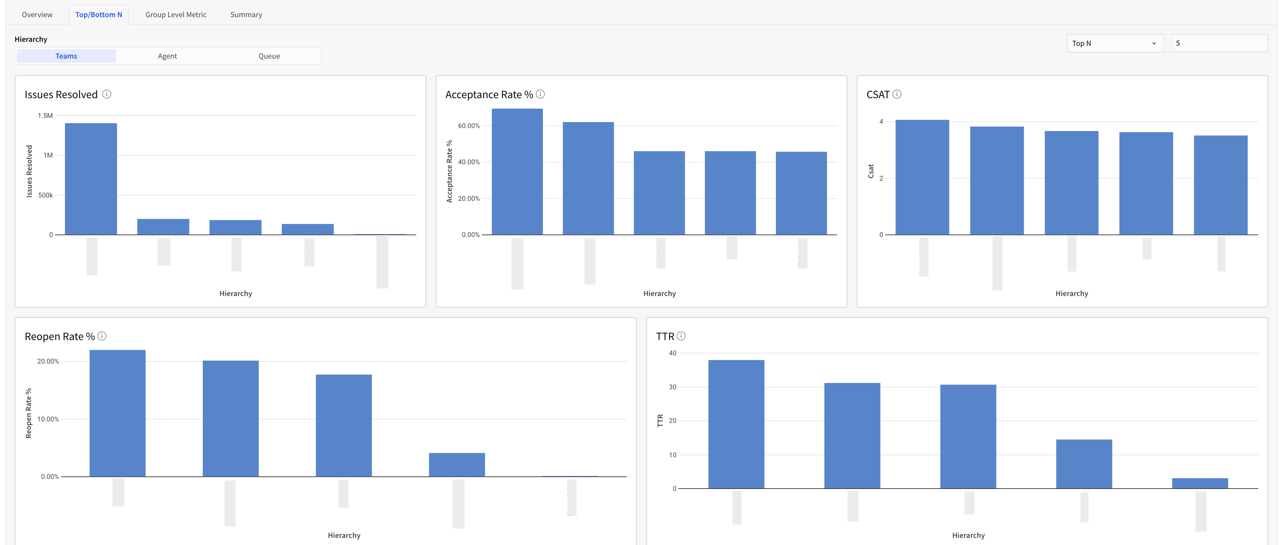
- Hierarchy Control is located in the Top/Bottom N container. This control lets you toggle between Team, Agent, and Queue to manage the data granularity on your charts.
Detailed information on each metric is given below:
| Metric | What does it measure? | How do we calculate it? |
| Online Agents | No. of Distinct online Agents in the Selected time period | CountDistinctIf([Agent Id], [Online Time Ms] > 0) |
| Online Time | Time (in D:H:M:S) duration during which the agent was marked available and also online for support | Text(Floor(Sum([Online Time Ms]) / 86400000)) & "D " & Text(Floor(Mod(Sum([Online Time Ms]), 86400000) / 3600000)) & "H " & Text(Floor(Mod(Sum([Online Time Ms]), 3600000) / 60000)) & "M " & Text(Floor(Mod(Sum([Online Time Ms]), 60000) / 1000)) & "S" |
| Available Time | Time (in D:H:M:S) duration during which the agent was marked available for support | Text(Floor(Zn(Sum([Available Time Ms])) / 86400000)) & "D " & Text(Floor(Mod(Zn(Sum([Available Time Ms])), 86400000) / 3600000)) & "H " & Text(Floor(Mod(Zn(Sum([Available Time Ms])), 3600000) / 60000)) & "M " & Text(Floor(Mod(Zn(Sum([Available Time Ms])), 60000) / 1000)) & "S " & " (" & Text(Round(Zn(Sum([Available Time Ms])) / Zn(Sum([Online Time Ms])) * 100, 2)) & "%)" |
| Issues Assigned | No. of issue assignments to the agent in the selected time period | Sum([Issues Assigned Count]) |
| Issues Touched | No. of Outbound responses, Issue Resolves, and Issue Rejects by the agent in the selected time period | Sum([Issue Touches Count]) |
| Issues Resolved | No. of issue resolutions by the agent in the selected time period | Sum([Issue Resolves Count]) |
| Acceptance Rate % | Shows the percentage of end-user resolution acceptance for issues resolved by the agent within the selected time period | Sum([Resolution Accept Count]) / (Sum([Resolution Reject Count]) + Sum([Resolution Accept Count]) |
| Reopens Rate % | Shows the percentage of end-user reopens for issues resolved by the agent within the selected time period | Sum([Reopens Count]) / Sum([Issue Resolves Count]) |
| Outbound Messages Per Resolve | Shows the average number of outbound messages sent by an agent to resolve a single issue within the selected time period | Sum([Outbound Resp Count]) / Sum([Issue Resolves Count]) |
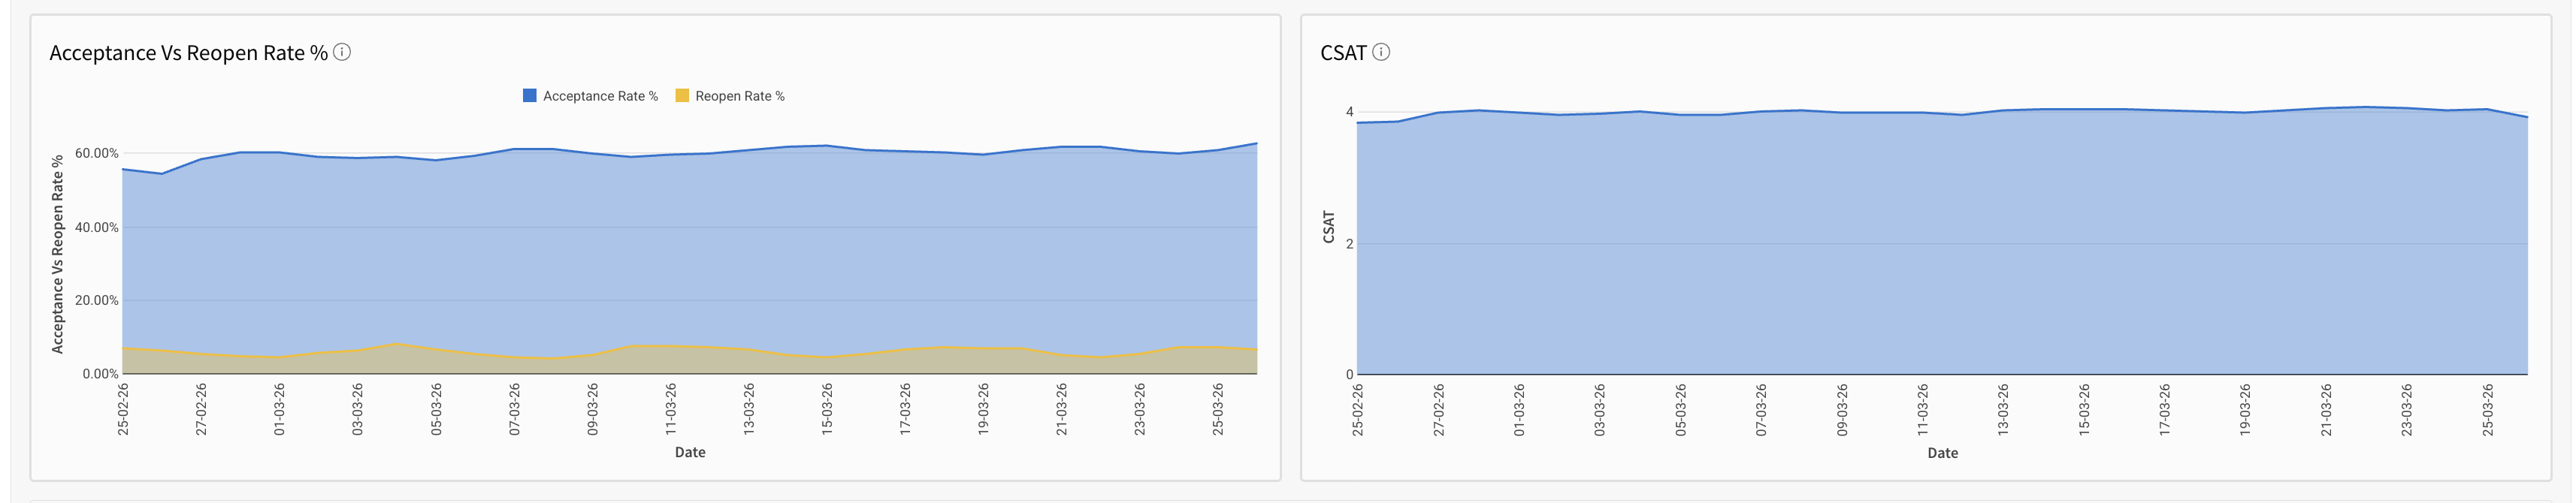
| CSAT | Avg. CSAT for all issues that received the CSAT rating | Sum([Csat Sum]) / Sum([Csat Count]) |
| Issues Assigned Vs Resolved % | Shows the trend of issues assigned compared with the Issue Resolved percentage over time | Issues Assigned = Sum([Issues Assigned Count]) Issues Resolved = Sum([Issue Resolves Count]) / Sum([Issues Assigned Count]) |
| Acceptance Vs Reopen Rate % | Shows the trend of Acceptance Rate % compared with the Reopen Rate % over time | Acceptance rate % = Sum([Resolution Accept Count]) / (Sum([Resolution Reject Count]) + Sum([Resolution Accept Count])) Reopen Rate % = Sum([Reopens Count]) / Sum([Issue Resolves Count]) |
| Online Vs Available Time | Total logged-in duration versus time spent waiting for new support | Online Time = Sum([Online Time Ms]) Available Time = Sum([Available Time Ms]) |
| Time to First Response Sum | Average time taken to provide the very first response to a new request | Sum([Time to First Response Sum Ms]) / Sum([Time to First Response Count]) |
| Time To Resolve | Average duration from the start of an issue creation until it is fully resolved | Sum([Time to Resolve Sum Ms]) / Sum([Time to Resolve Count]) |
| Time For Each Response | Average customer wait time between all individual messages in a thread | Sum([Time for Each Resp Sum Ms]) / Sum([Time for Each Resp Count]) |
| Top/Bottom N: Issues Resolved | Shows the top and bottom N issues successfully closed or marked as resolved by Hierarchy | Sum([Issue Resolves Count]) |
| Top/Bottom N: Acceptance Rate % | Shows the top and bottom N percentage of assigned issues that were successfully accepted by Hierarchy | Sum([Resolution Accept Count]) / (Sum([Resolution Reject Count]) + Sum([Resolution Accept Count])) |
| Top/Bottom N: CSAT | Shows the top and bottom N Average customer satisfaction scores received for resolved issues by Hierarchy | Sum([Csat Sum]) / Sum([Csat Count]) |
| Top/Bottom N: Reopen Rate % | Shows the top and bottom N Percentage of resolved issues that were reopened by Hierarchy | Sum([Reopens Count]) / Sum([Issue Resolves Count]) |
| Top/Bottom N: Time To Resolve | Shows the top and bottom N Average time to resolve successful issues in Hours, measuring the speed of issue completion by Hierarchy | (Sum([Time to Resolve Sum Ms]) / 3600000) / Sum([Time to Resolve Count]) |
| Group Level Metric: Issues Assigned Vs Resolved % | Shows the volume of issues assigned to each group compared to how many they successfully resolved in percentage | Issues Assigned = Sum([Issues Assigned Count]) Issues Resolved = Sum([Issue Resolves Count]) / Sum([Issues Assigned Count]) |
| Group Level Metric: Issues Resolved Vs CSAT | Shows the total number of issues resolved alongside the average customer satisfaction score for each group | Issues Resolved = Sum([Issue Resolves Count]) CSAT= Sum([Csat Sum]) / Sum([Csat Count]) |
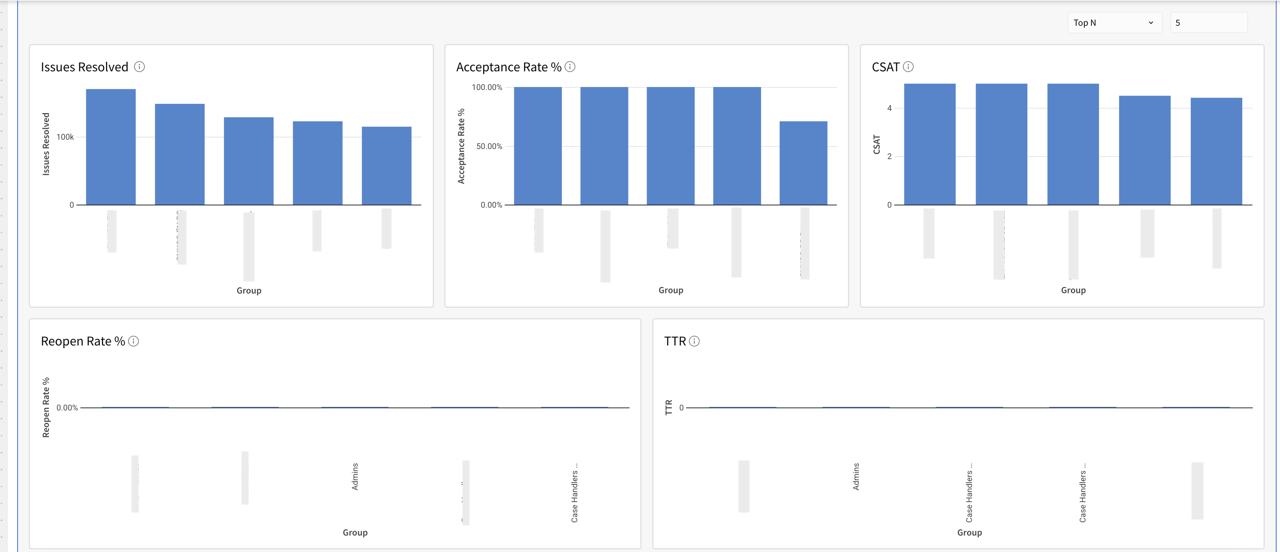
| Group Level Metric: Issues Resolved | Shows the top and bottom N issues successfully closed or marked as resolved by Group Name | Sum([Issue Resolves Count]) |
| Group Level Metric: Acceptance Rate % | Shows the top and bottom N percentage of assigned issues that were successfully accepted by Group Name | Sum([Resolution Accept Count]) / (Sum([Resolution Reject Count]) + Sum([Resolution Accept Count])) |
| Group Level Metric: CSAT | Shows the top and bottom N Average customer satisfaction score received for resolved issues by Group Name | Sum([Csat Sum]) / Sum([Csat Count]) |
| Group Level Metric: Reopen Rate % | Shows the top and bottom N Percentage of resolved issues that were reopened by Group Name | Sum([Reopens Count]) / Sum([Issue Resolves Count]) |
| Group Level Metric: Time To Resolve | Shows the top and bottom N Average time to resolve successful issues in Hours, measuring the speed of issue completion by Group Name | (Sum([Time to Resolve Sum Ms]) / 3600000) / Sum([Time to Resolve Count]) |
| Summary Table | A consolidated view of all metrics, grouped by date/Agent name and date/Group name, to track performance trends and compare metrics across time periods at a glance. | All the calculations are the same as the metric level calculation, and are put all together in Tables as a Summary |
Note: Metrics such as Active Users and Contact Rate rely on App Profile data. Please upgrade your SDK and integrate the new Identity Login API to enable App Profiles.
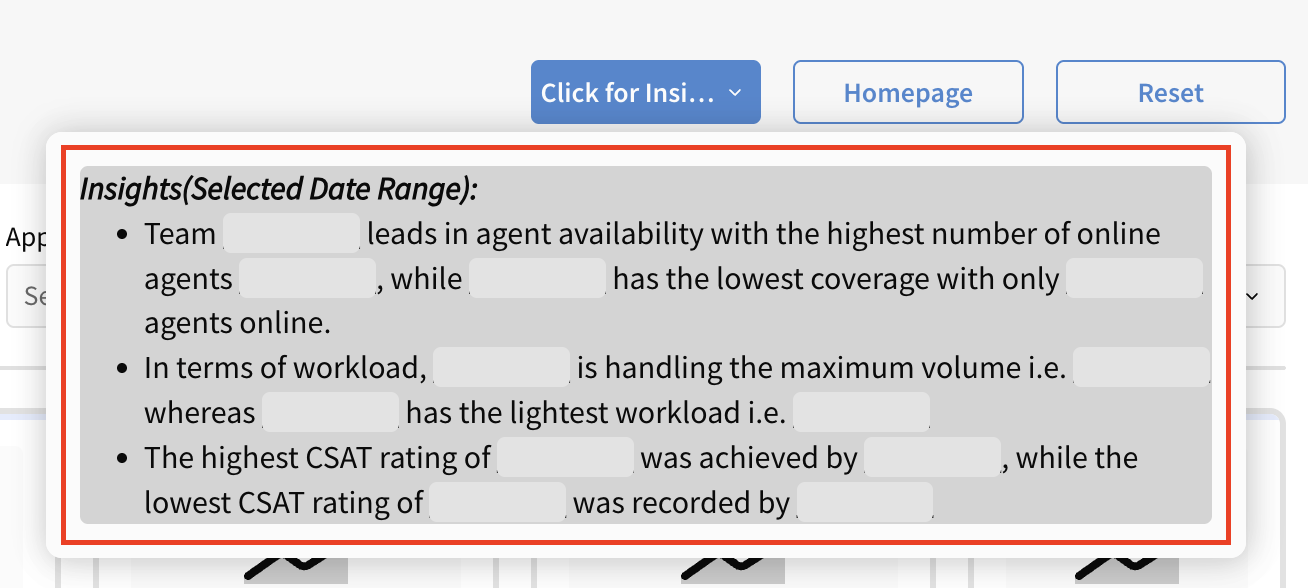
Pro Tip: Click the Click on Insight button to quickly view key insights from the report.
| Overview |
   |
| Top/Bottom N |
 |
| Group Level Metric |
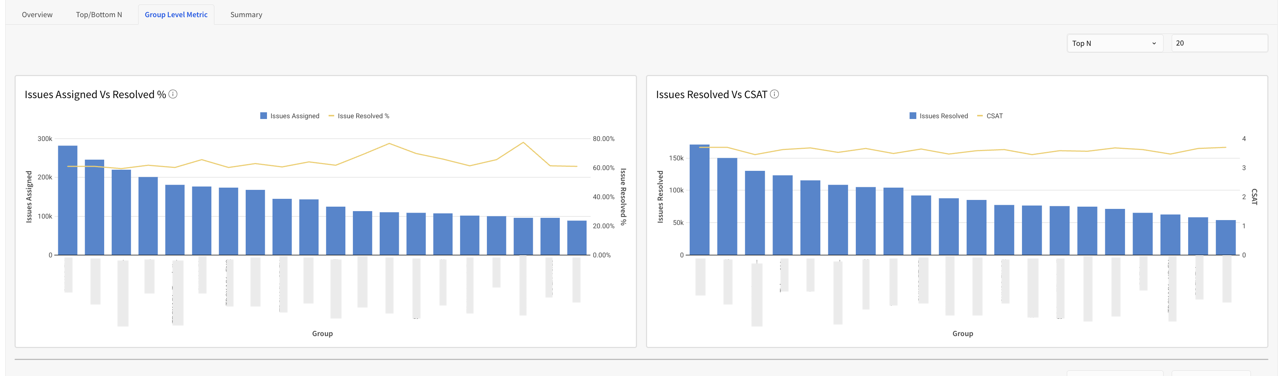  |
Summary Section
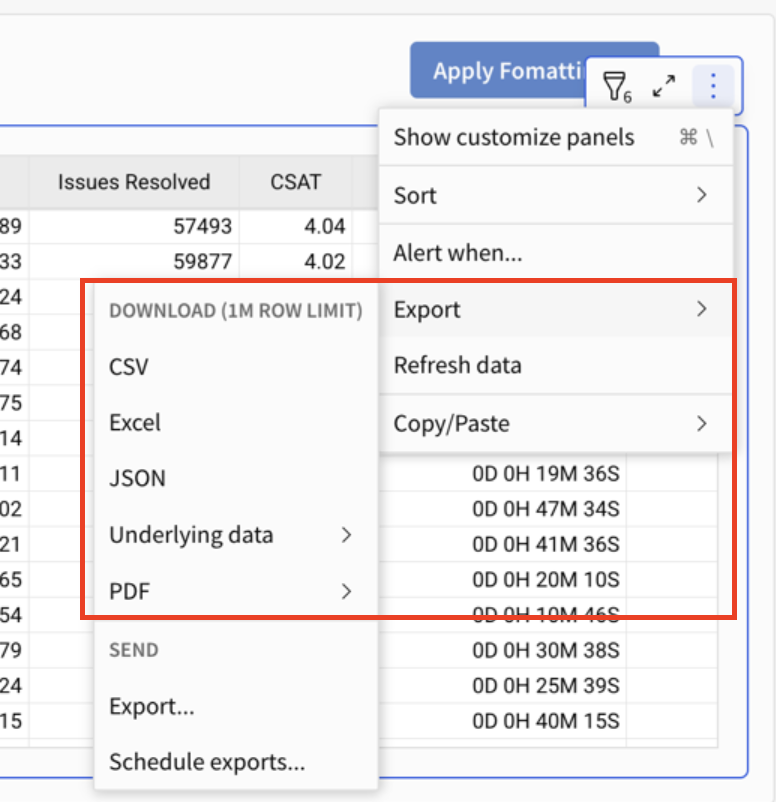
All the metrics mentioned above are also available in table format in the Summary Section. You can also download the data for every table in various formats by clicking on the Export option.
Pro Tip: Use Apply Formatting (top-right of the template) to instantly apply conditional formatting and highlight key metrics within the table. For example, you can set a rule to highlight values when Issues Assigned exceeds 9, making it easier to spot trends and outliers at a glance.
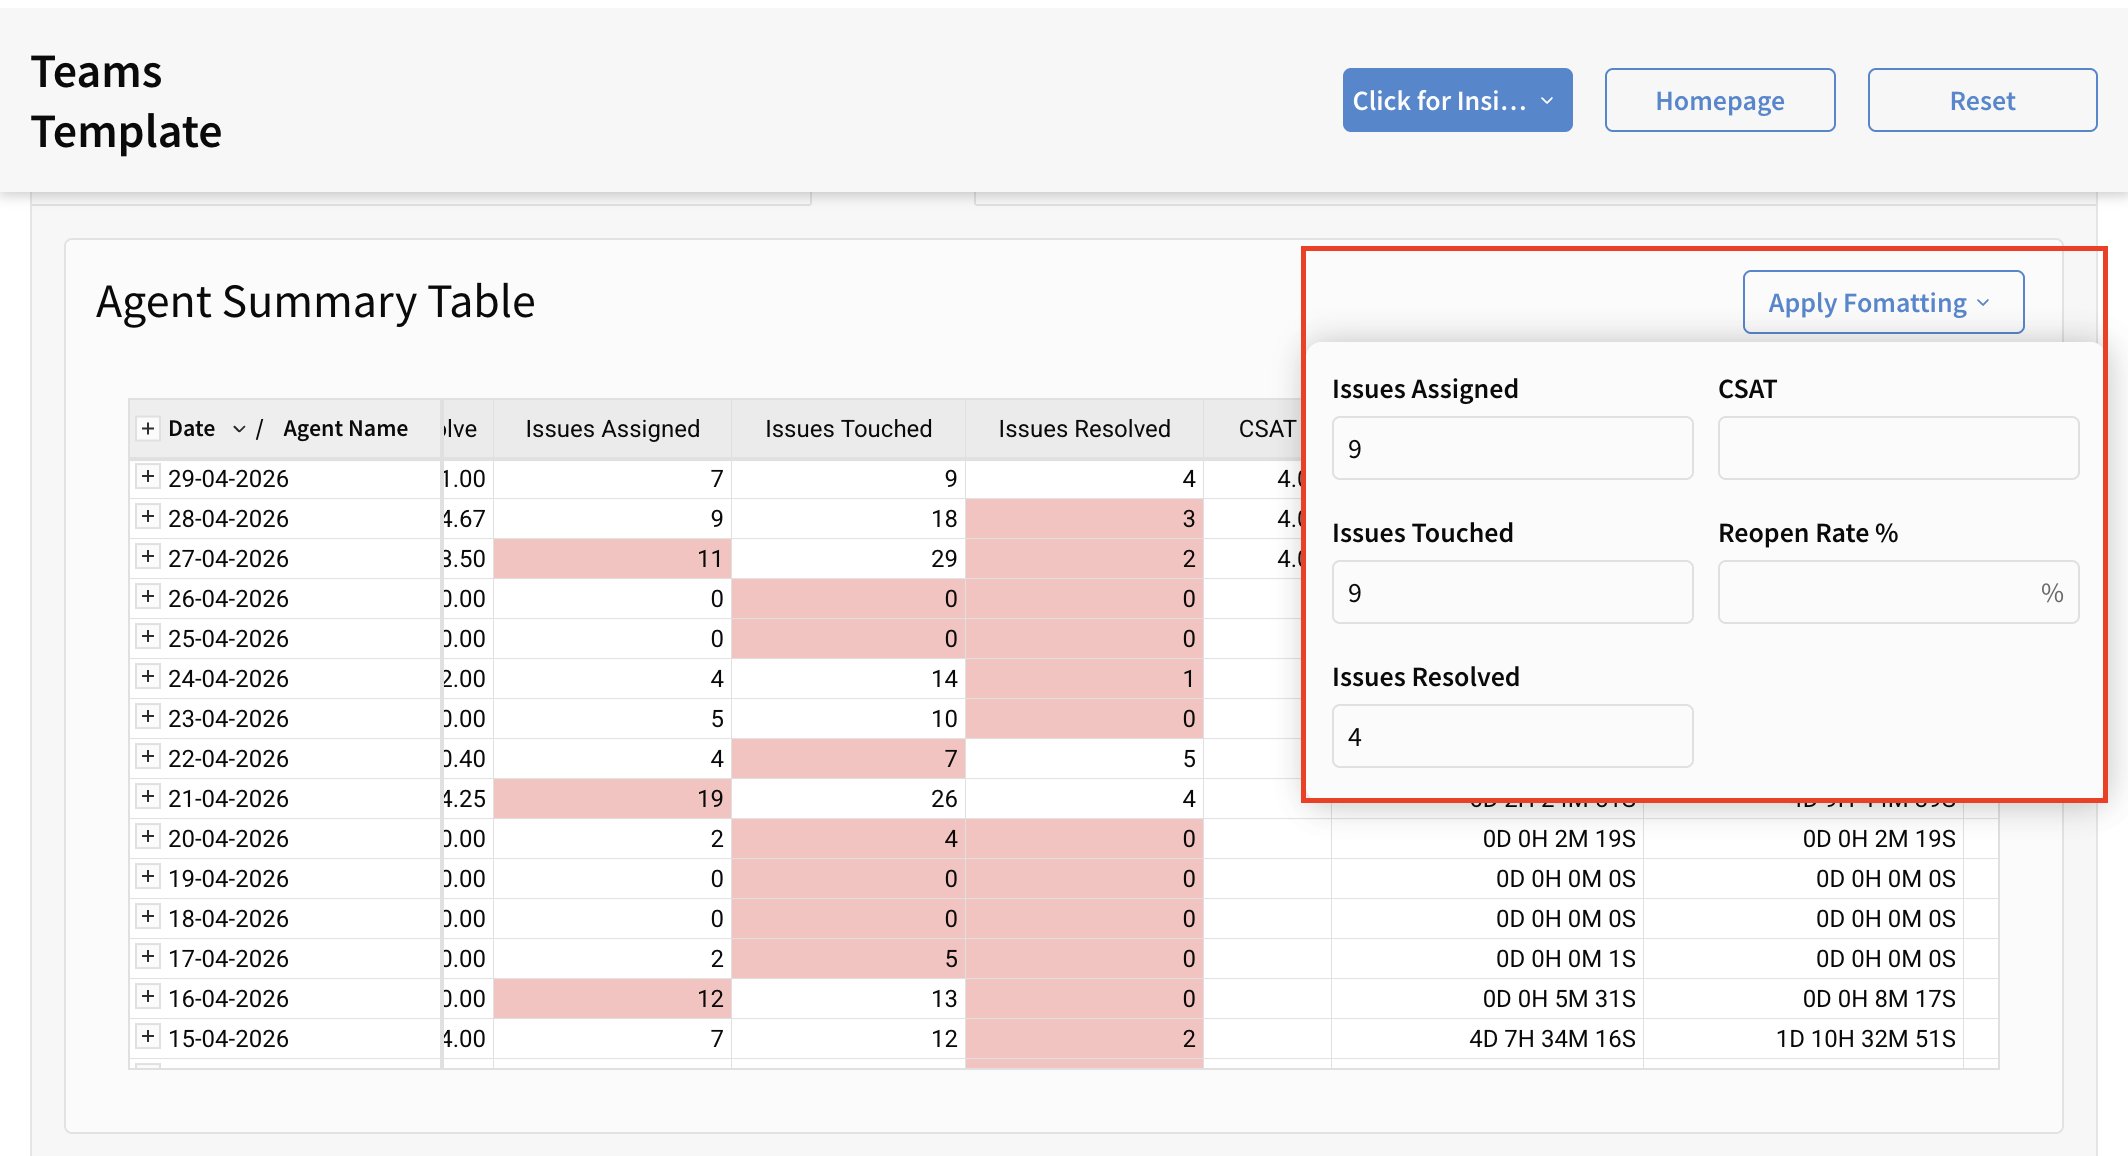
Note: There are four tables in the Summary Section. Conditional formatting will apply only to the Agent Summary Table and the Group Summary Table. The remaining two tables display activity details (Last Online, Login, and Available Time) and do not interact with the formatting.